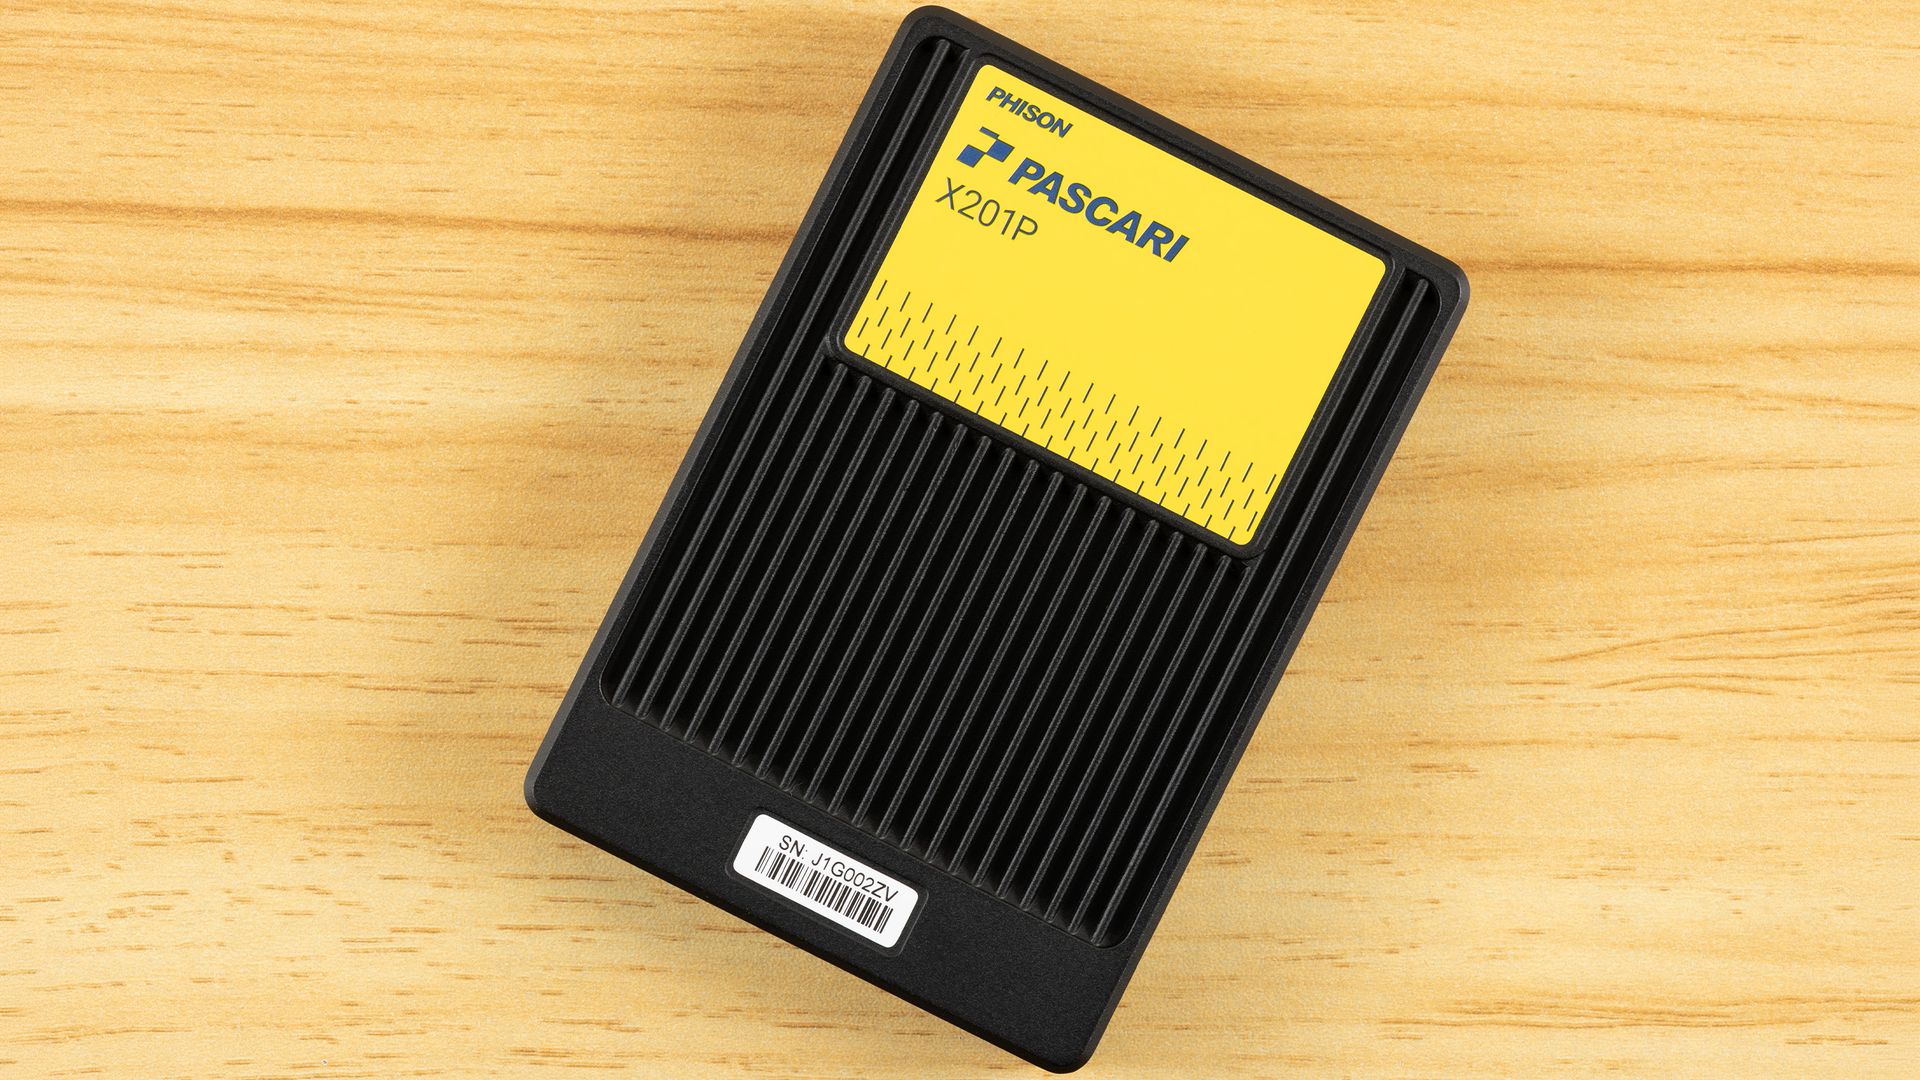
Phison is serious about enterprise storage, and the Pascari X201P was not released lightly; it came in the night, under NDA, alongside this week’s Supercomputing 2026 event. The drive is part of the Performance X-Series, which handles intensive workloads where consistency is the name of the game. We were nevertheless pleasantly surprised by its write performance, with a steady 12 GB/s for sequential and over 600,000 random write IOPS, considering it’s marketed at the 1 drive write per day (DWPD) endurance point.
Part of that surprise comes from the fact that this is Phison’s read-intensive PCIe 5.0 data center drive, a successor to the X200P. It comes in the U.2 form factor — which can be more convenient in many cases — from 1.92TB to 30.72TB, and an E3.S version from 3.84TB, in both single- and dual-port models. It stands next to its mixed-use sibling, the X201E, which is the one rated for 3 DWPD. What makes the X201P exciting, in part, is its own 16-channel X2 controller and the flash that’s inside.
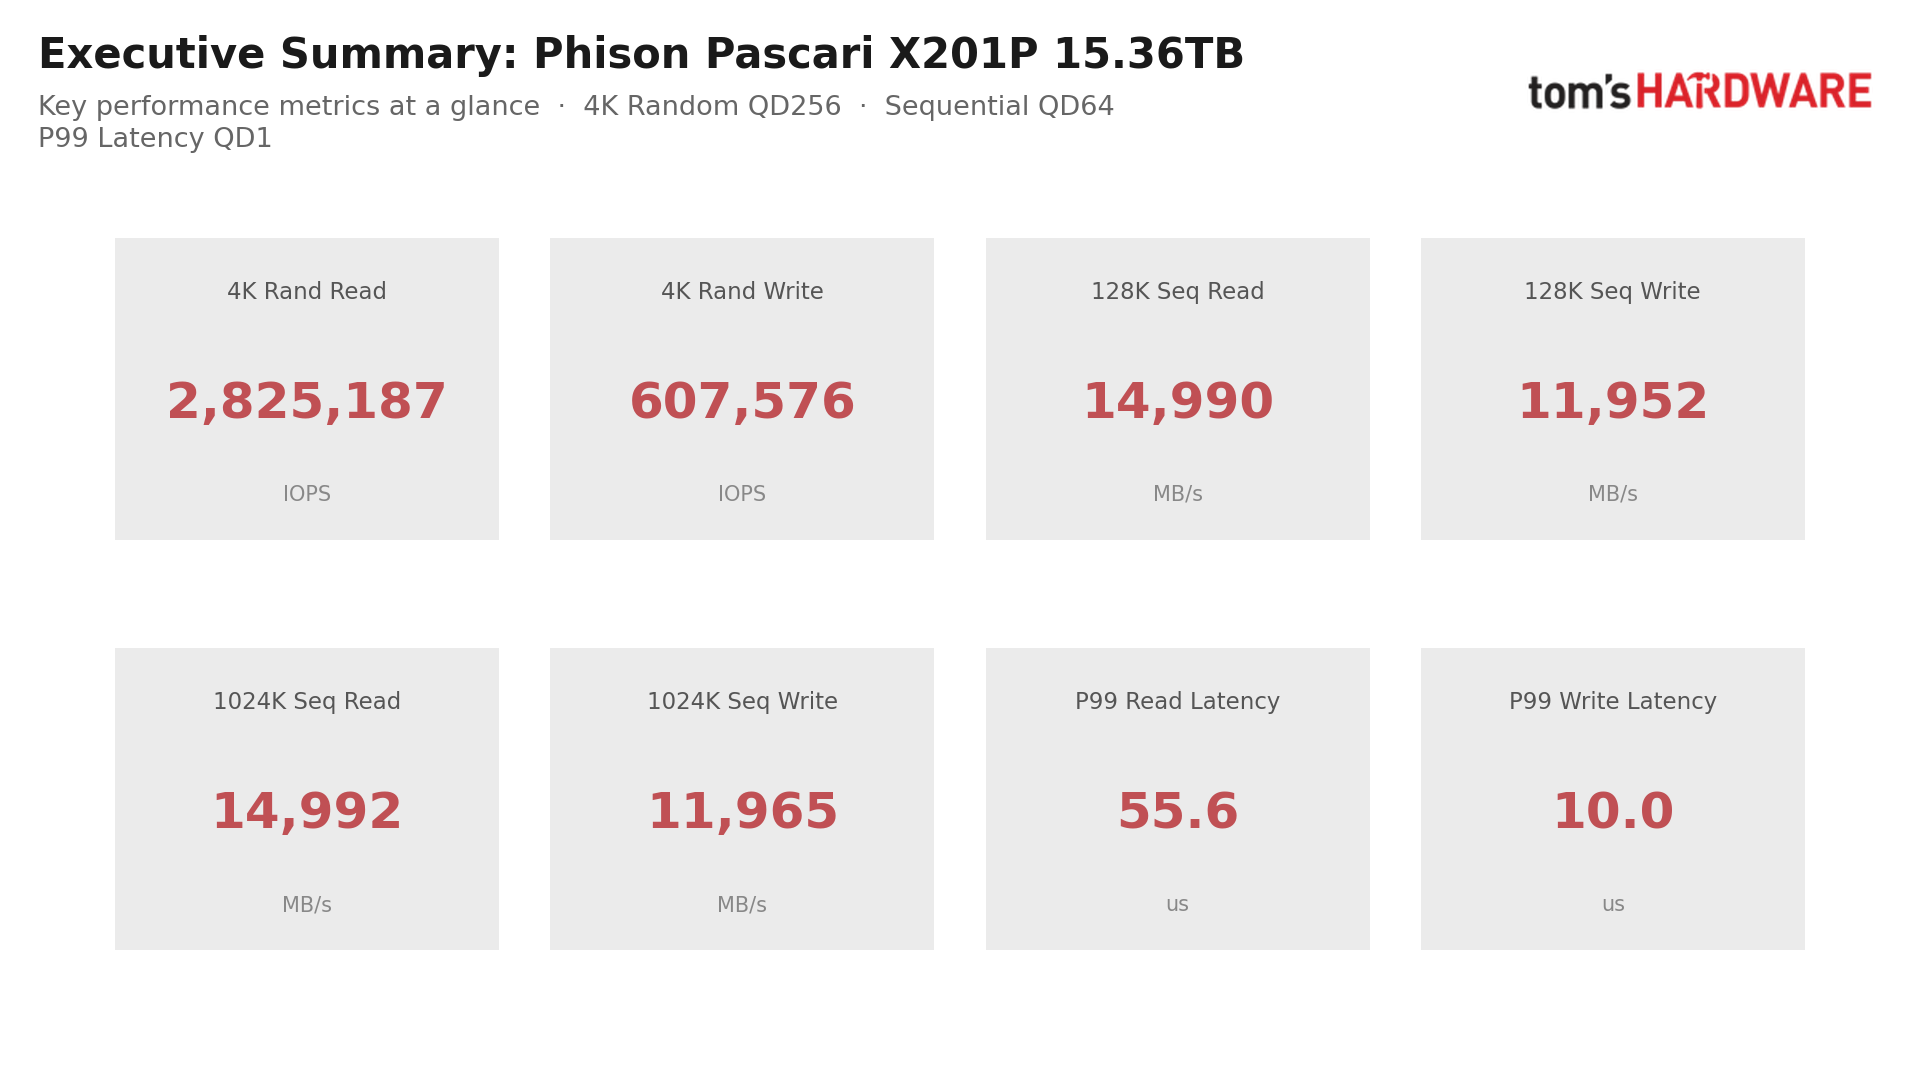
This drive is aimed at AI, analytics, and database servers, with its case made in the 4K 70/30 mix at higher queue depths. It passed Phison’s one-million-IOPS mark at QD128 in our testing of the 15.36TB model, and the drive met all of its rated specs, though its random read rating required polled I/O to reach on our bench. It faced challenges with QD1 writes, log commits, and the middle range of our mixed sweeps. Given its blend of performance, capacity, and endurance, we consider it a very competent entry from the company that was perhaps better known in the consumer SSD market until recently.
Phison Pascari X201P Specifications
Product | 1.92TB | 3.84TB | 7.68TB | 15.36TB | 30.72TB |
|---|---|---|---|---|---|
Pricing | N/A | N/A | N/A | N/A | N/A |
Form Factor | U.2 (15 mm) | U.2 (15 mm) | U.2 (15 mm) | U.2 (15 mm) | U.2 (15 mm) |
Interface / Protocol | PCIe 5.0 x4 / NVMe 2.0d | PCIe 5.0 x4 / NVMe 2.0d | PCIe 5.0 x4 / NVMe 2.0d | PCIe 5.0 x4 / NVMe 2.0d | PCIe 5.0 x4 / NVMe 2.0d |
Controller | Phison X2 | Phison X2 | Phison X2 | Phison X2 | Phison X2 |
DRAM | Yes (size not published) | Yes (size not published) | Yes (size not published) | Yes (size not published) | Yes (size not published) |
Memory | 3D TLC | 3D TLC | 3D TLC | 321-layer 3D TLC | 3D TLC |
Sequential Read | 14,800 MB/s | 14,800 MB/s | 14,800 MB/s | 14,800 MB/s | 14,800 MB/s |
Sequential Write | 2,300 MB/s | 4,600 MB/s | 9,200 MB/s | 11,800 MB/s | 10,000 MB/s |
Random Read | 1,400K | 2,700K | 3,300K | 3,250K | 2,800K |
Random Write | 75K | 230K | 480K | 600K | 490K |
Security | ISE or SED (TCG Opal 2.02) | ISE or SED (TCG Opal 2.02) | ISE or SED (TCG Opal 2.02) | ISE or SED (TCG Opal 2.02) | ISE or SED (TCG Opal 2.02) |
Power-Loss Protection | Yes | Yes | Yes | Yes | Yes |
Endurance | 1 DWPD | 1 DWPD | 1 DWPD | 1 DWPD | 1 DWPD |
Power (Active / Idle) | ≤25 W / ≤5 W | ≤25 W / ≤5 W | ≤25 W / ≤5 W | ≤25 W / ≤5 W | ≤25 W / ≤5 W |
Part Number (ISE) | XP208H081T92P322T0410 | XP208H083T84P324T0910 | XP208H087T68P328T1910 | XP208H0815T3P3216T310 | XP208H0830T7P3232T710 |
Part Number (SED) | XP208H081T92P222T0410 | XP208H083T84P224T0910 | XP208H087T68P228T1910 | XP208H0815T3P2216T310 | XP208H0830T7P2232T710 |
Height | 15 mm | 15 mm | 15 mm | 15 mm | 15 mm |
Warranty | 5-Year | 5-Year | 5-Year | 5-Year | 5-Year |
The drive met or beat every rated performance figure that we can test, which should be the target of any enterprise SSD released today. If there’s an exception, it’s due to how we test; Phison lists a ceiling of 3,250K IOPS for 4K random read, which is higher than our bench allows with our interrupt-driven I/O, which we use rather than a polled approach. We also run a polled test on every drive for cases like this, and our result was 3,283K IOPS at the same queue depth Phison specifies, which shows the drive does exceed its specification.
Phison Pascari X201P Features and Management
Feature | Phison Pascari X201P |
|---|---|
NVMe Specification | NVMe 2.0d |
OCP Specification | Datacenter NVMe SSD v2.0, with v2.6 telemetry features |
Host Link | PCIe 5.0 x4, single port (2x2 dual-port models offered) |
Power-Loss Protection | Yes |
End-to-End Data Protection | Yes |
Security Options | ISE, SED (TCG Opal 2.02) or non-SED; AES-XTS 256-bit |
Sanitize | Cryptographic erase and block erase |
LBA Formats | 512-byte and 4,096-byte, each with optional metadata |
Namespaces | Up to 128 |
Power States | Six: 25 W, 22 W, 20 W, 18 W, 15 W and 12 W maximum |
Temperature Thresholds | 77°C warning, 85°C critical |
Thermal Management | Host-controlled thermal management supported |
Firmware Slots | Seven; activation without reset |
Out-of-Band Management | NVMe-MI 1.2 over SMBus and PCIe |
Flexible Data Placement | Not supported |
Tested Firmware | X2WM6026 |
Phison Pascari X201P: A Closer Look
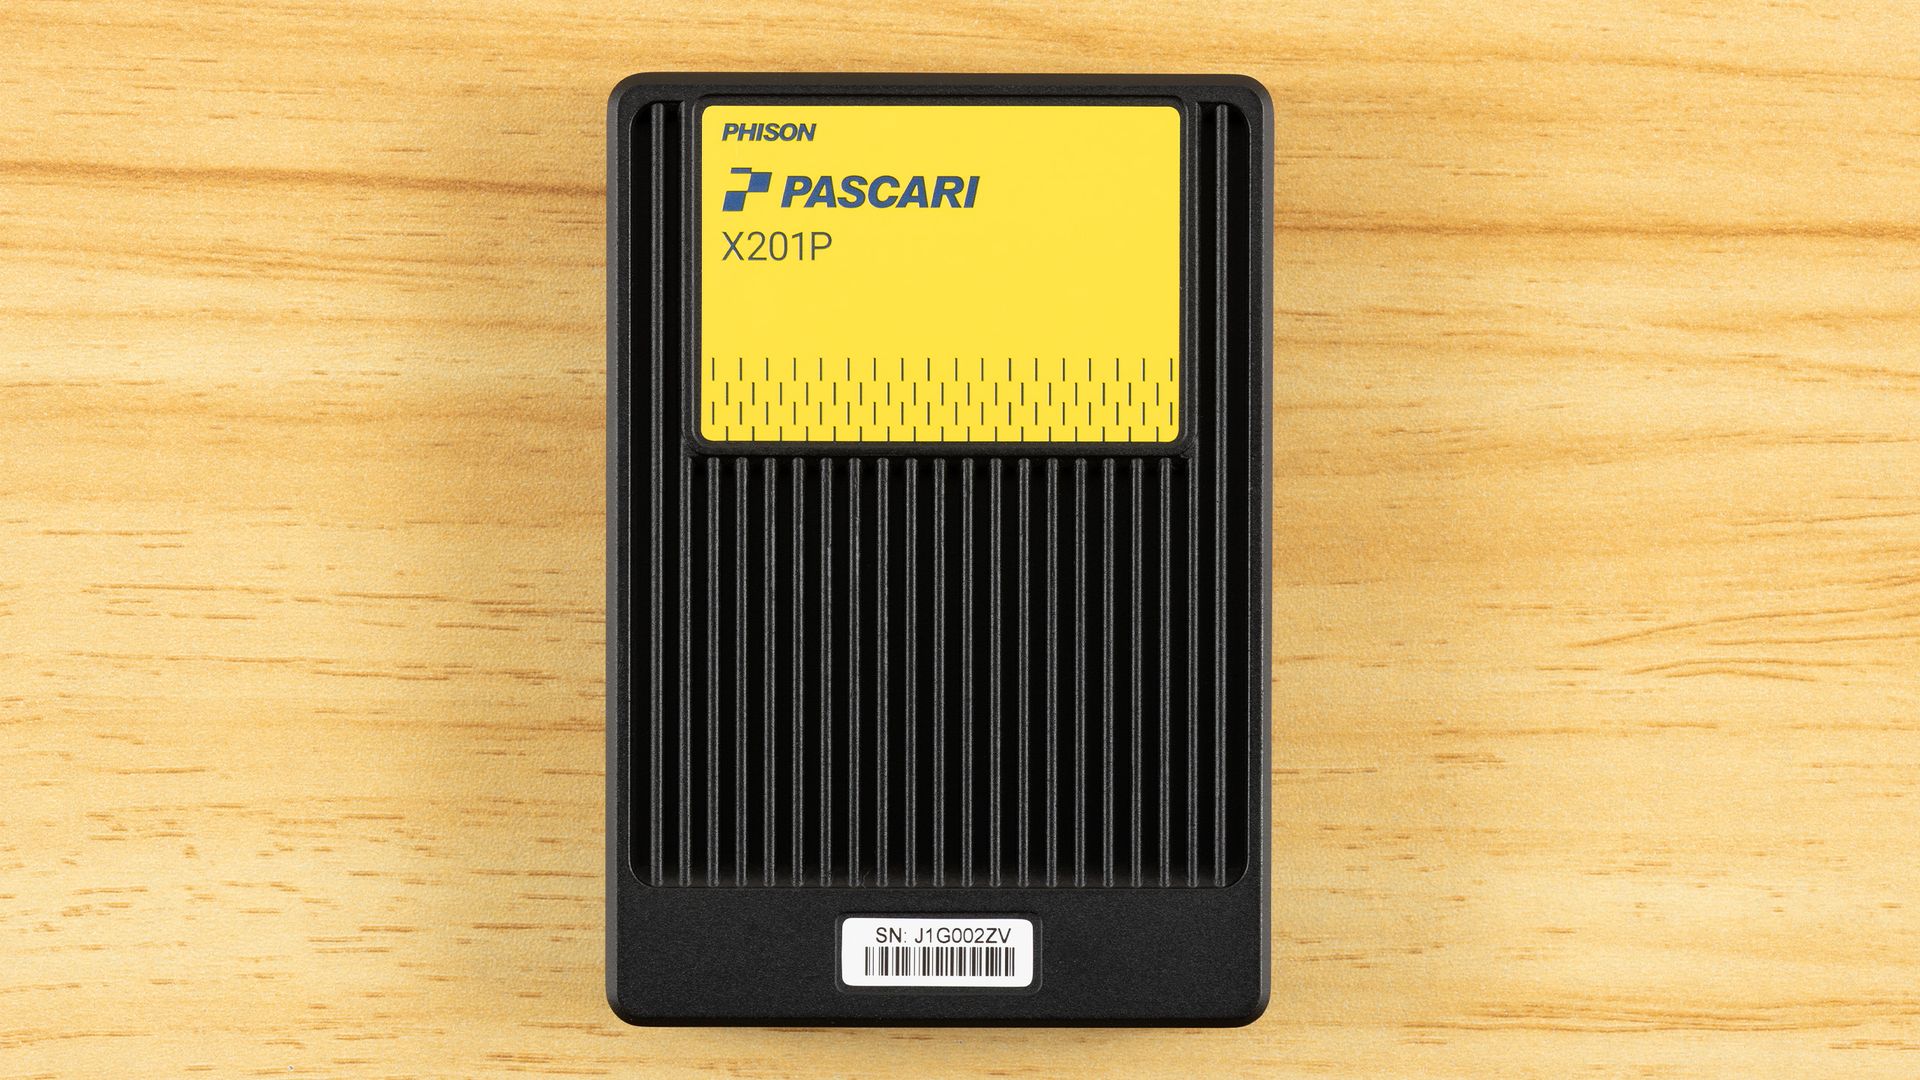
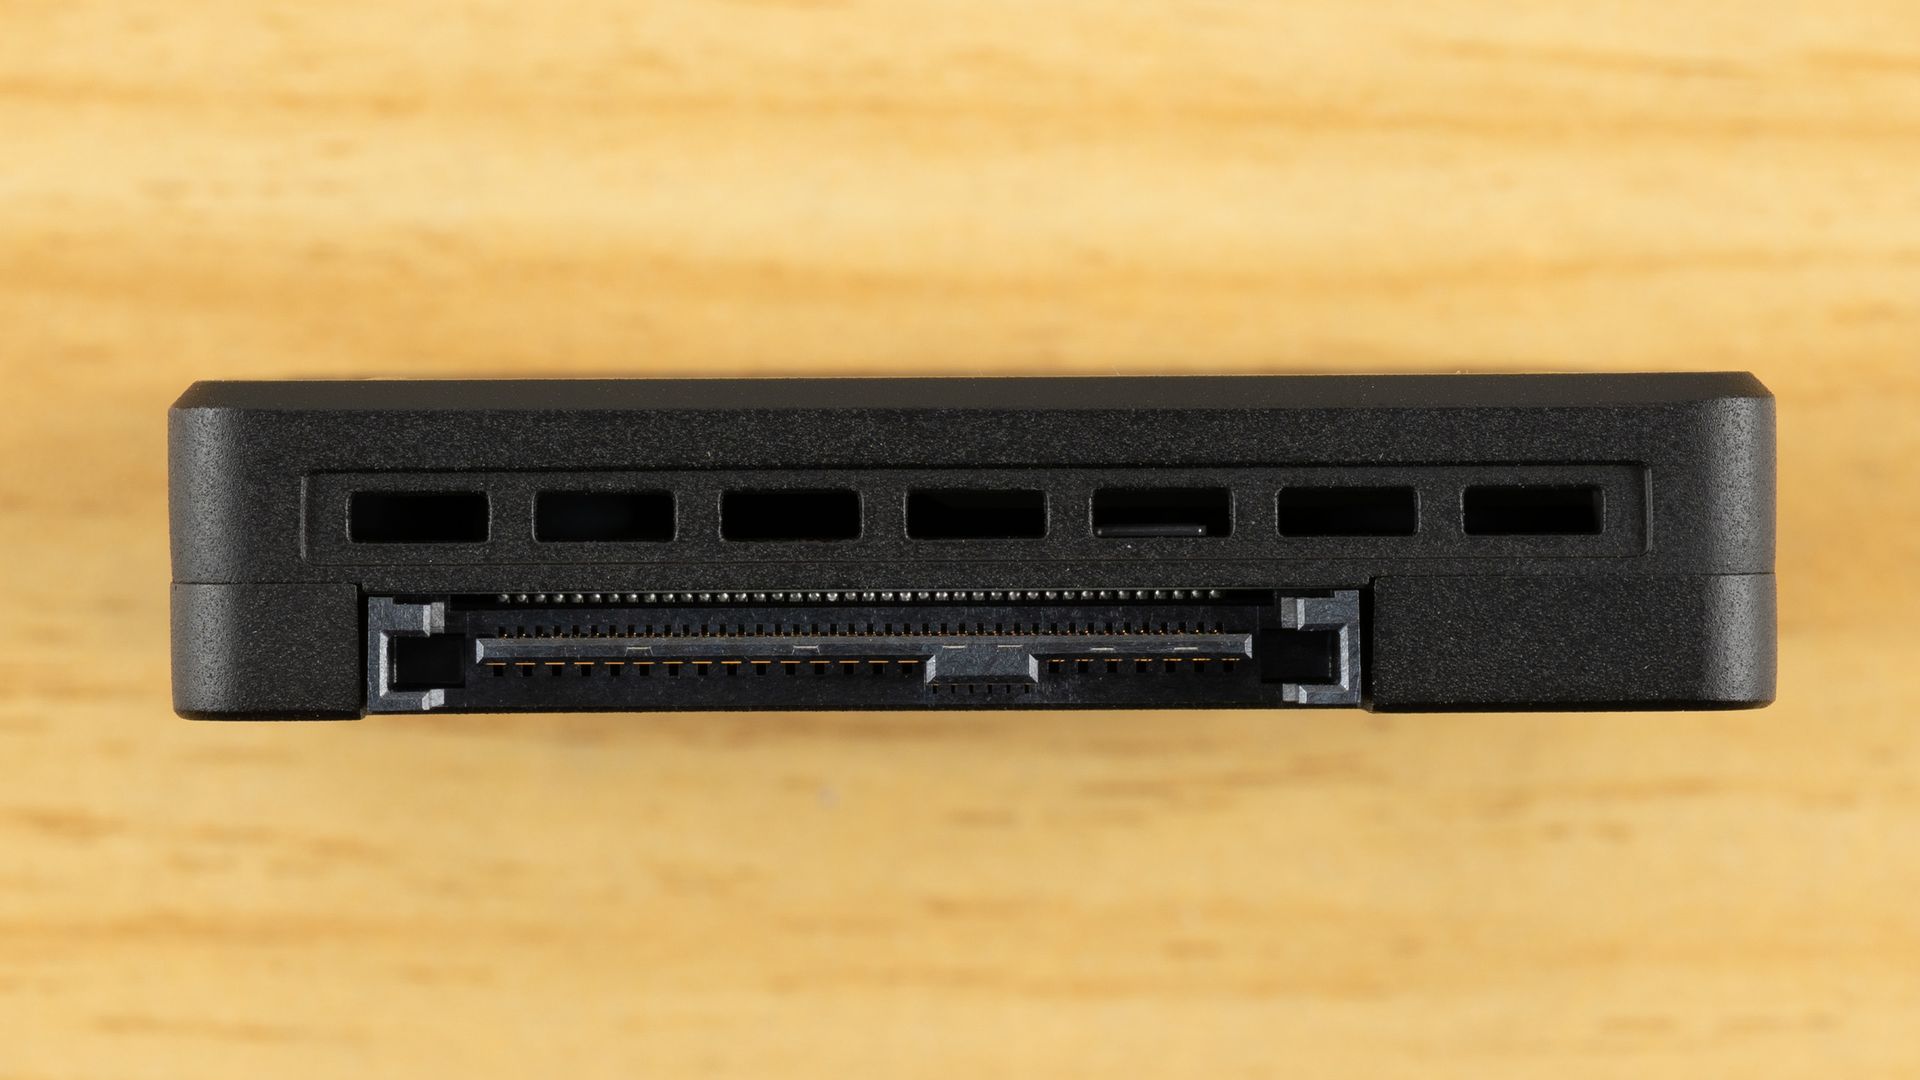
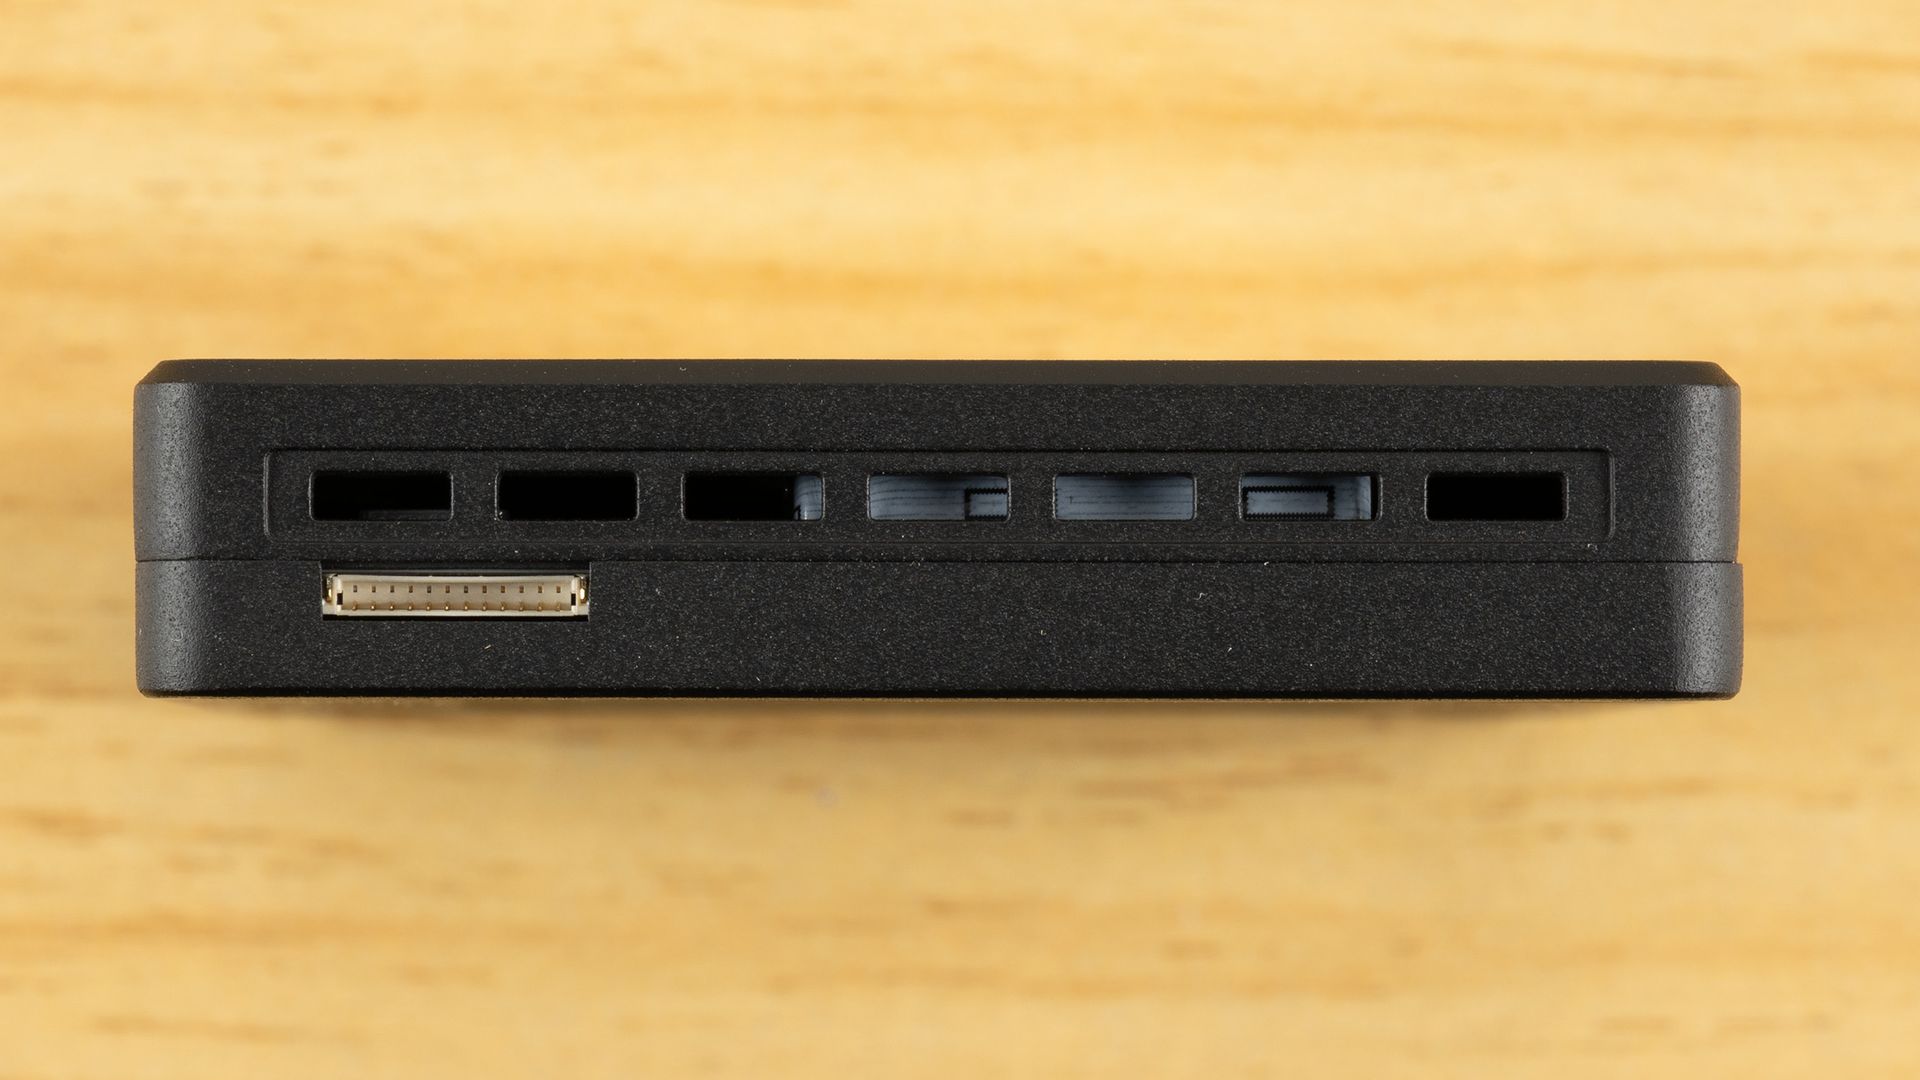
Our sample is in the U.2 form factor, 15mm thick. We have the single-port SKU, ISE model XP208H0815T3P3216T310, with firmware X2WM6026. Some data we previously saw from the drive was reportedly on X2WM6025, but we confirmed X2WM6026 for all relevant results. We mounted the drive on a PCIe 5.0 x4 add-in card adapter for U.2, standing upright in the slot.
Phison did not provide firm hardware details, but we were able to discover some things on our own. The flash was probably the easiest, as the company claimed it was a 321-layer part. That can only be SK hynix’s V9 TLC, which is not flash we’ve tested before in any product. It’s exceptionally fast and uses a three-deck design, which is relatively new for TLC flash. The flash could be credited with some of the exceptional performance measurements we see on the drive.
As for the proprietary controller, we’ve heard that it’s using a combination of the standard Arm Cortex-R5 — these would be the main cores — with AndesCore RISC-V on the side. We’ve seen the latter before on the Phison E28 consumer SSD controller, which did have some enterprise-like aspects to it. The E28 is the newer design, built on a 6nm process with Andes’ newer N45 cores alongside the N25F, while the X2 is a 12nm part that, as far as we can tell, sticks with N25F-class co-processors.
In this case, the X2 has twice the flash channels, which enables a superior level of performance out of TLC flash, as in enterprise you do not rely on pSLC. That mix of cores sets the X2 apart from other 16-channel PCIe 5.0 enterprise controllers: Marvell’s Bravera SC5 and Silicon Motion’s SM8366 rely on Arm cores throughout, whereas Phison pairs its Cortex-R5 cores with small RISC-V co-processors.
MORE: Best SSDs
MORE: Best External SSDs
MORE: Best SSD for the Steam Deck
Comparison Products
The comparison drive today is the Kioxia CD9P-R 7.68TB in the E3.S form factor. It is the first drive we tested in our new enterprise SSD review suite, and is a good comparison despite its smaller capacity, as it’s also a 1 DWPD, read-intensive PCIe 5.0 TLC drive. We tested both with 512-byte sectors. The form factor is different, which shouldn’t affect performance, though it could play a part in the temperature results. You can read the finer details of our test environment in our How we test enterprise SSDs article.
We did re-test the Pascari on three sweep points where our initial results deviated from expectations, and this is something our test is designed to detect. The charts use the re-measured results for those three points.
Performance at a Glance
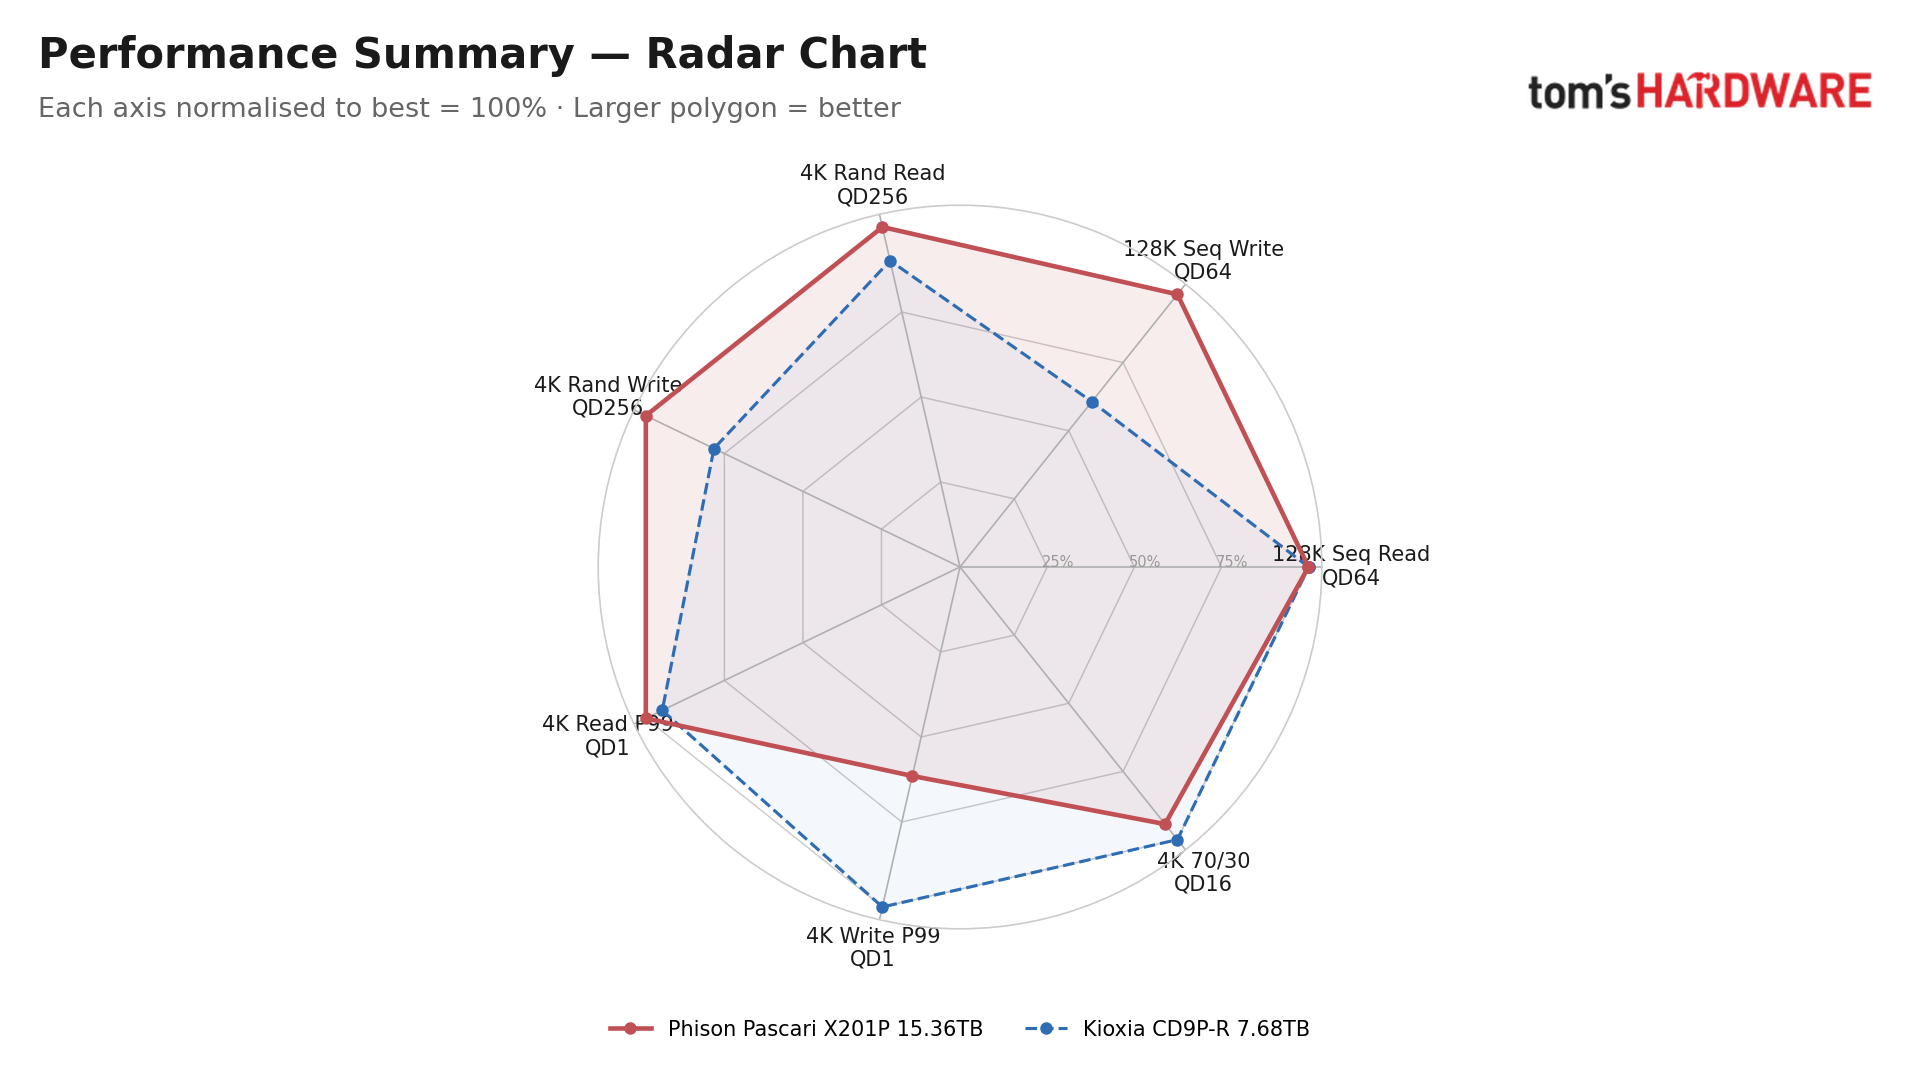
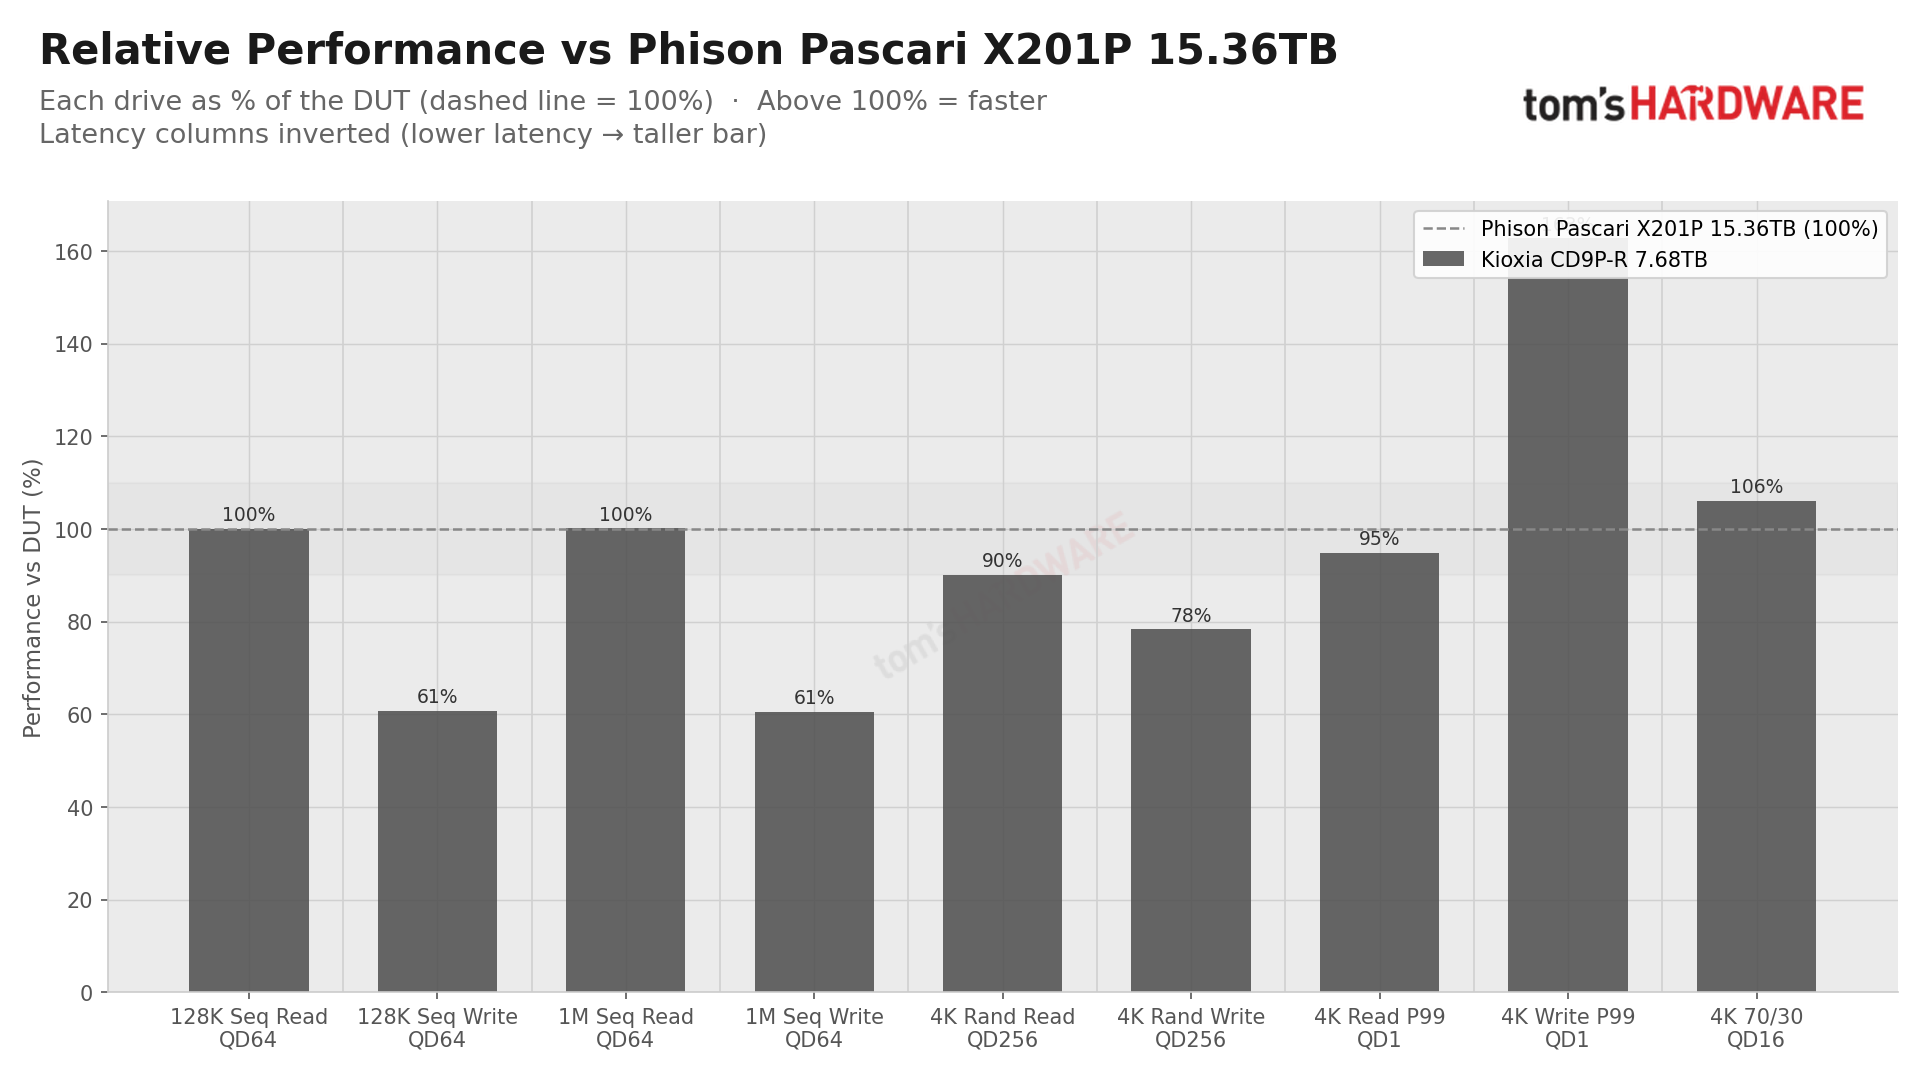
These charts summarize the results that follow. The radar chart is scaled to the drives in this review, so its shape can’t be compared across reviews, and its 70/30 axis is the 4K mix at QD16. Latency is P99 at QD1, rather than an average, and on the relative chart, lower latency is drawn as a taller bar.
The X201P leads in several areas, most of all with writes: it is 65% ahead on sequential writes and 28% ahead on 4K random writes. 4K random reads are 11% ahead, and QD1 reads at P99 are 5% faster.
It trails on QD1 write latency at that same P99, though, at 10.0 versus 6.2 µs, with the CD9P-R’s 38% lower. The 4K 70/30 mix at QD16 has it about 6% behind, too. The drives are more or less the same with sequential read, because they are both at the 15 GB/s link limit. The most important gaps are the writes: these are large enough to lean towards the X201P for write-heavy work. The read-side gaps, meanwhile, are more modest.
Headline Performance — Four Corners
Four corners testing covers the four headline numbers on an SSD spec sheet: sequential reads and writes, plus 4K random reads and writes. We test sequential transfers at 128K and 1MB with a queue depth (QD) of 64, and 4K random at QD256, split across eight fio jobs, since a single job can’t keep up with faster drives. On the fastest drives, the 4K random read result is capped by our bench rather than the drive, which is described in our testing notes and is covered by our polled test section further down.
Each test runs in the state the drive would be in after a long stretch of that kind of workload: the random tests start only after the drive passes our steady-state check, and we repeat the 4K write hours later to make sure it holds. The sequential tests, similarly, follow a full sequential fill. The results show what a drive sustains rather than what it manages fresh out of the box.
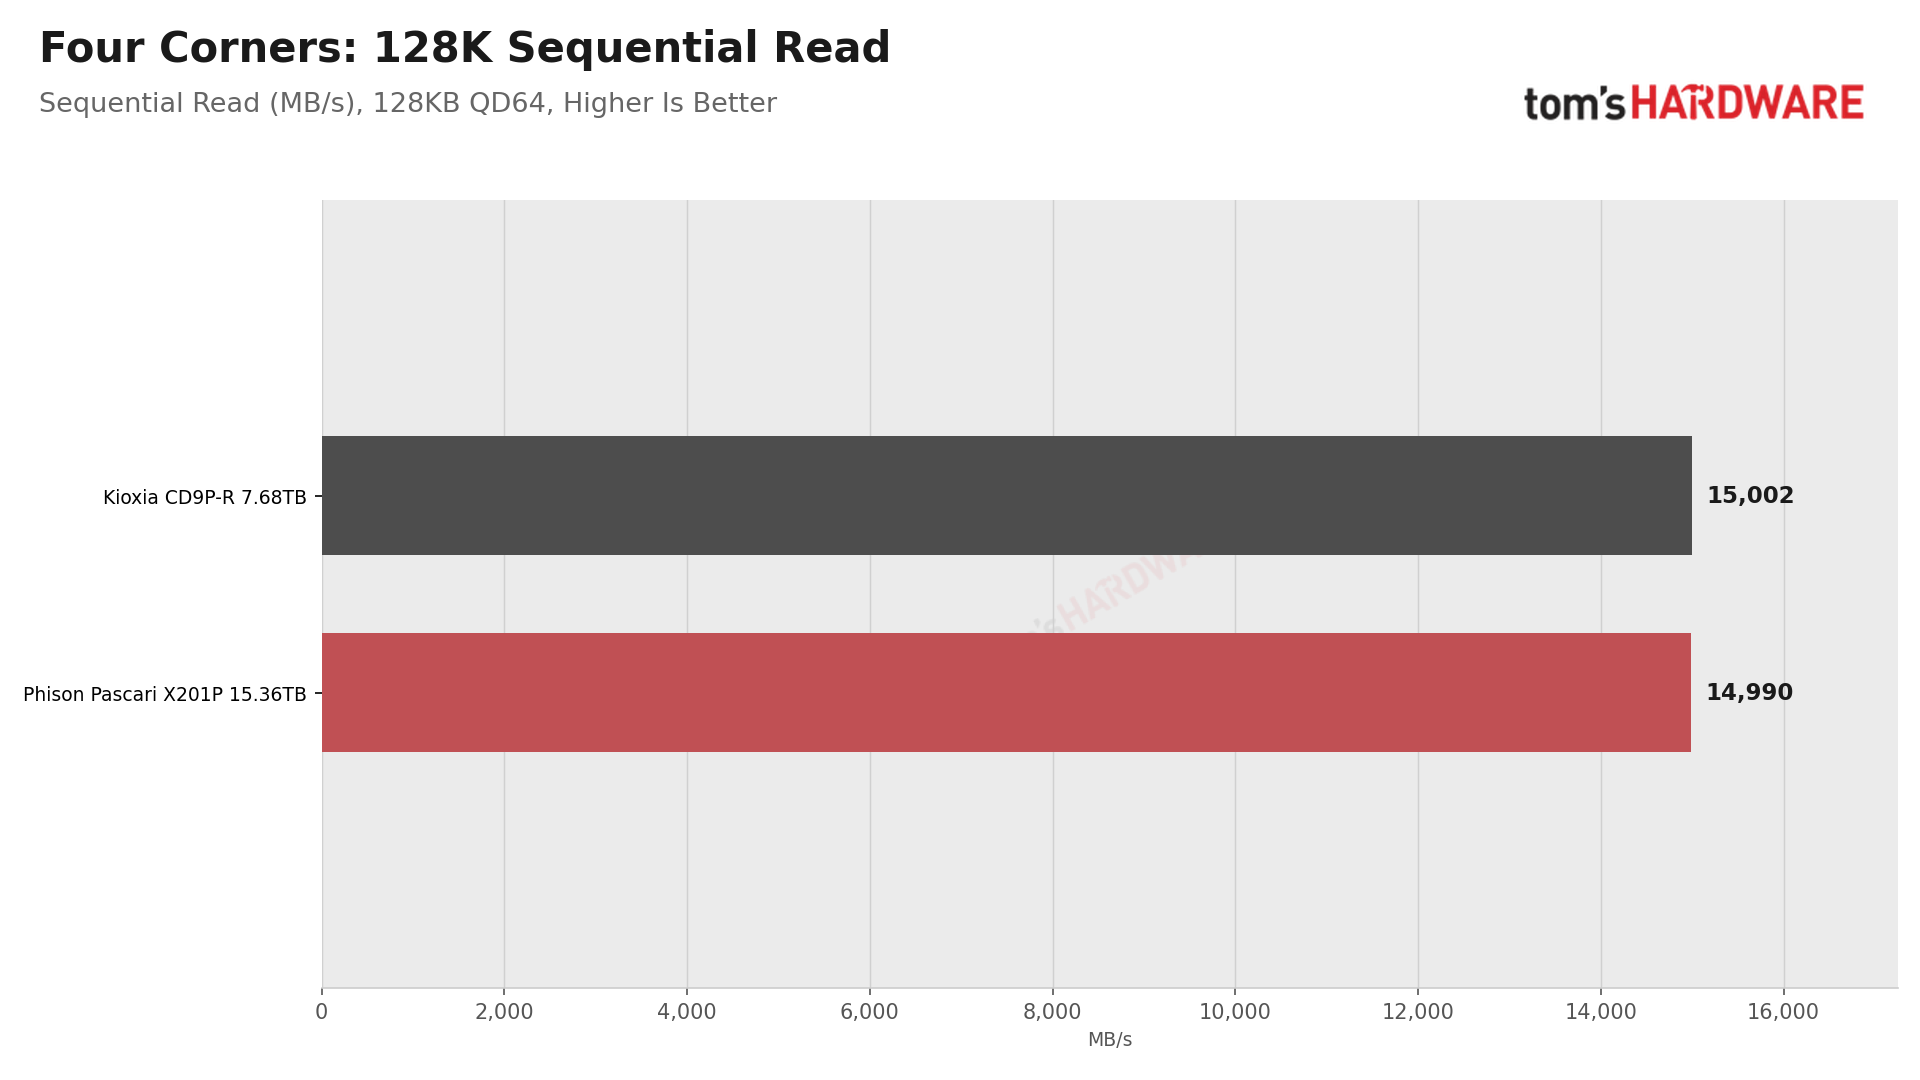
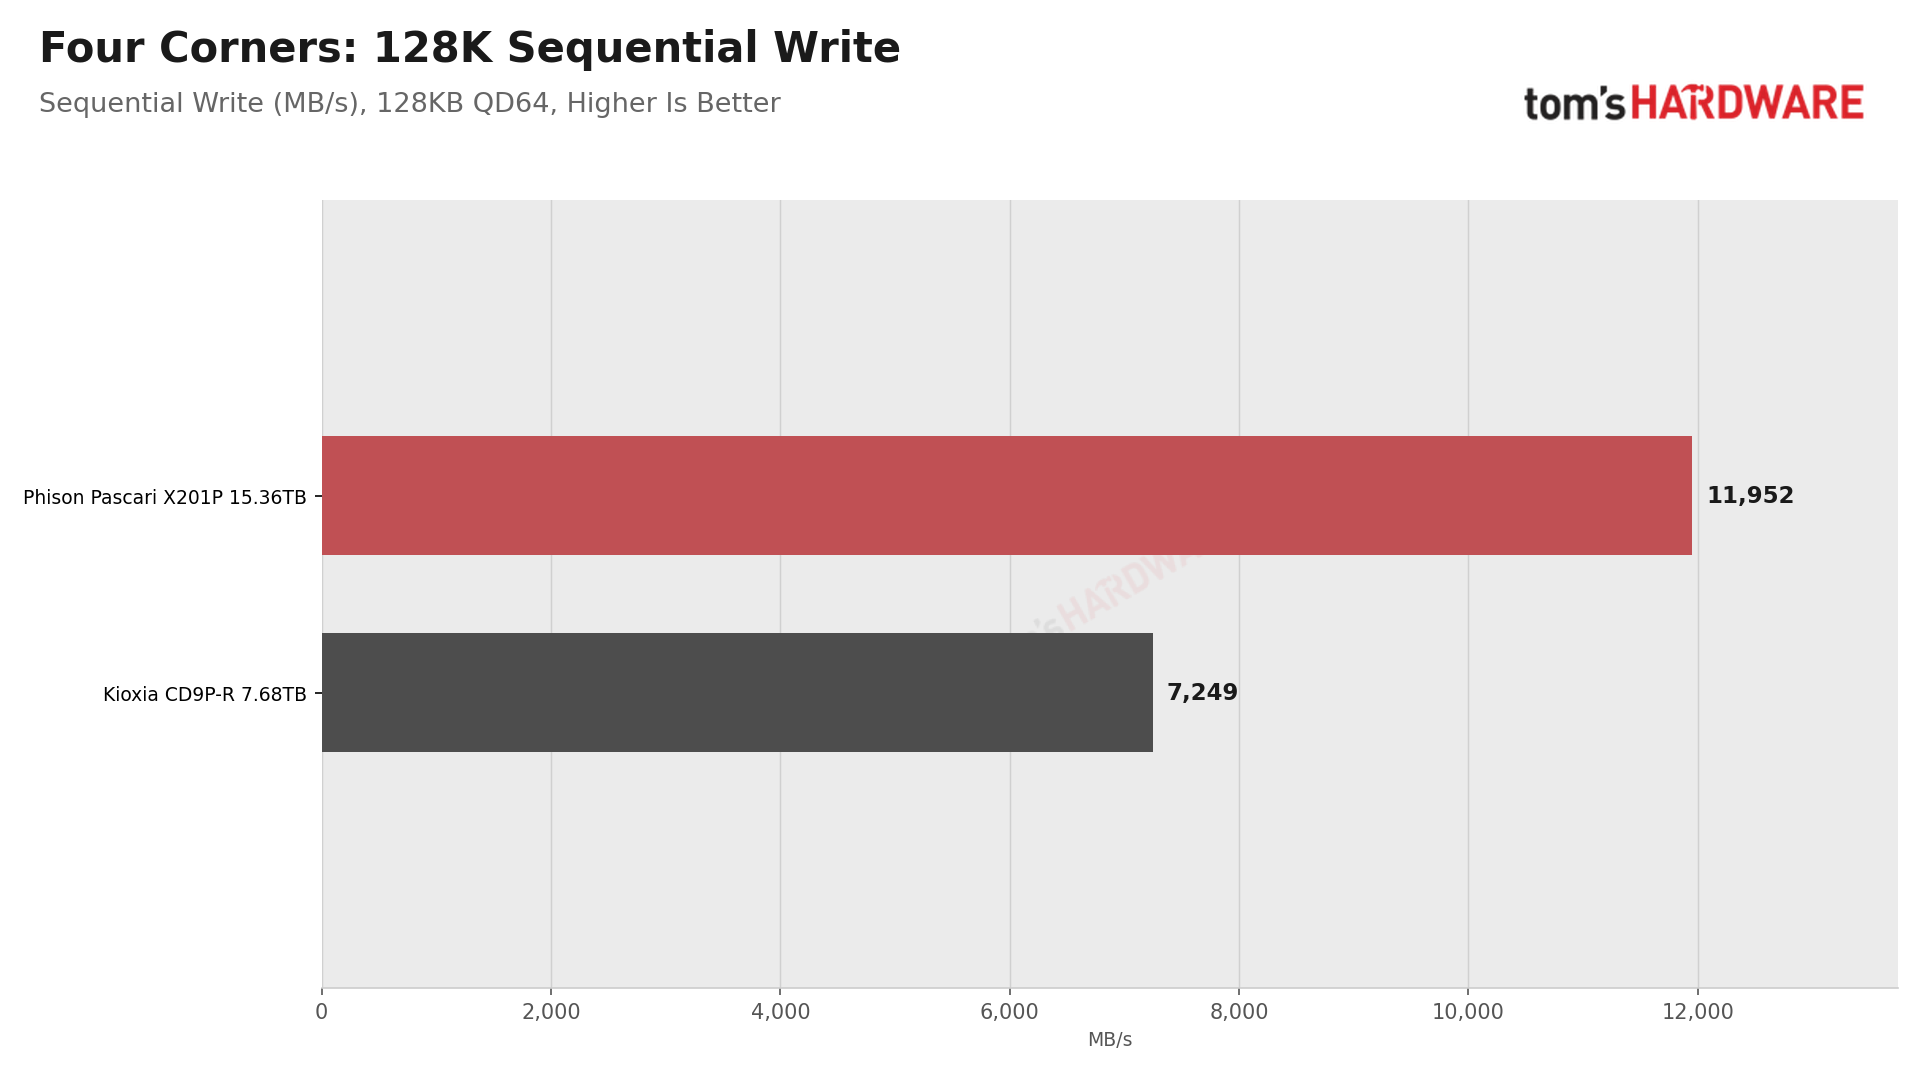
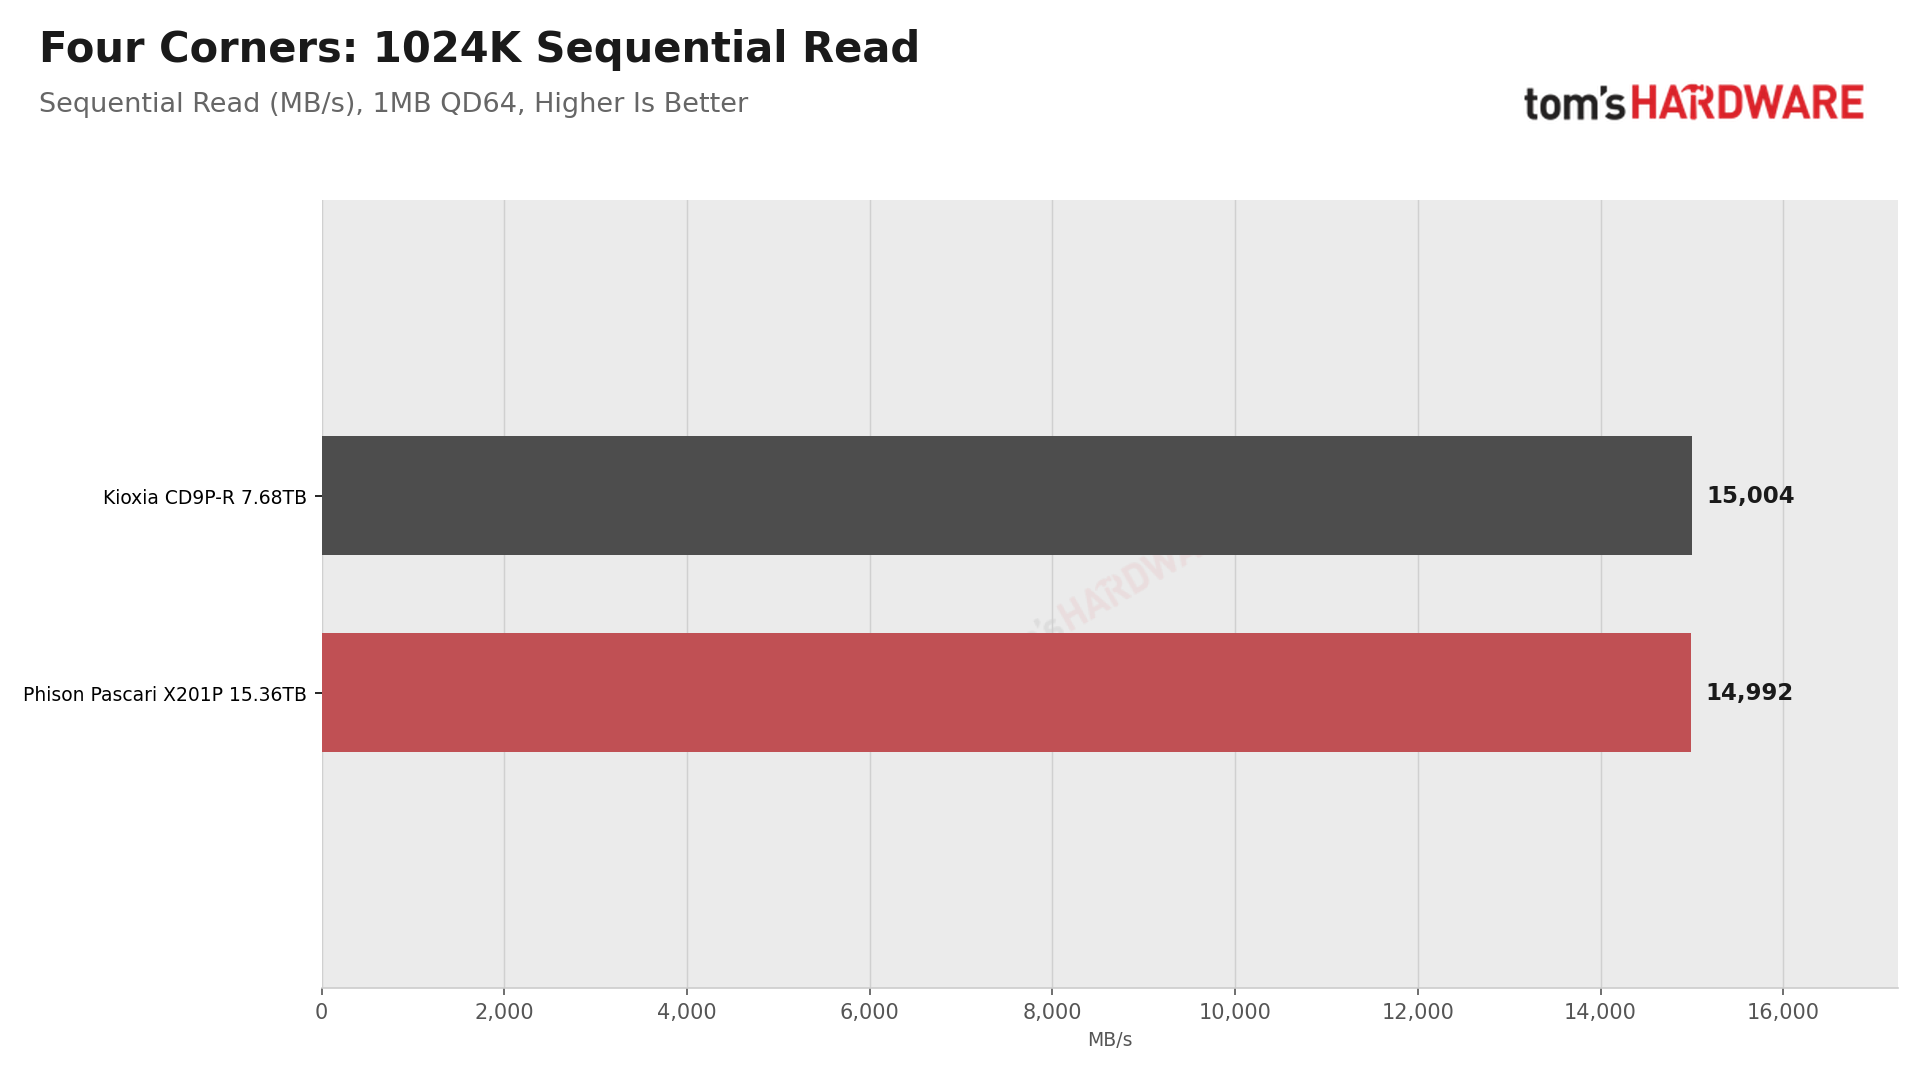
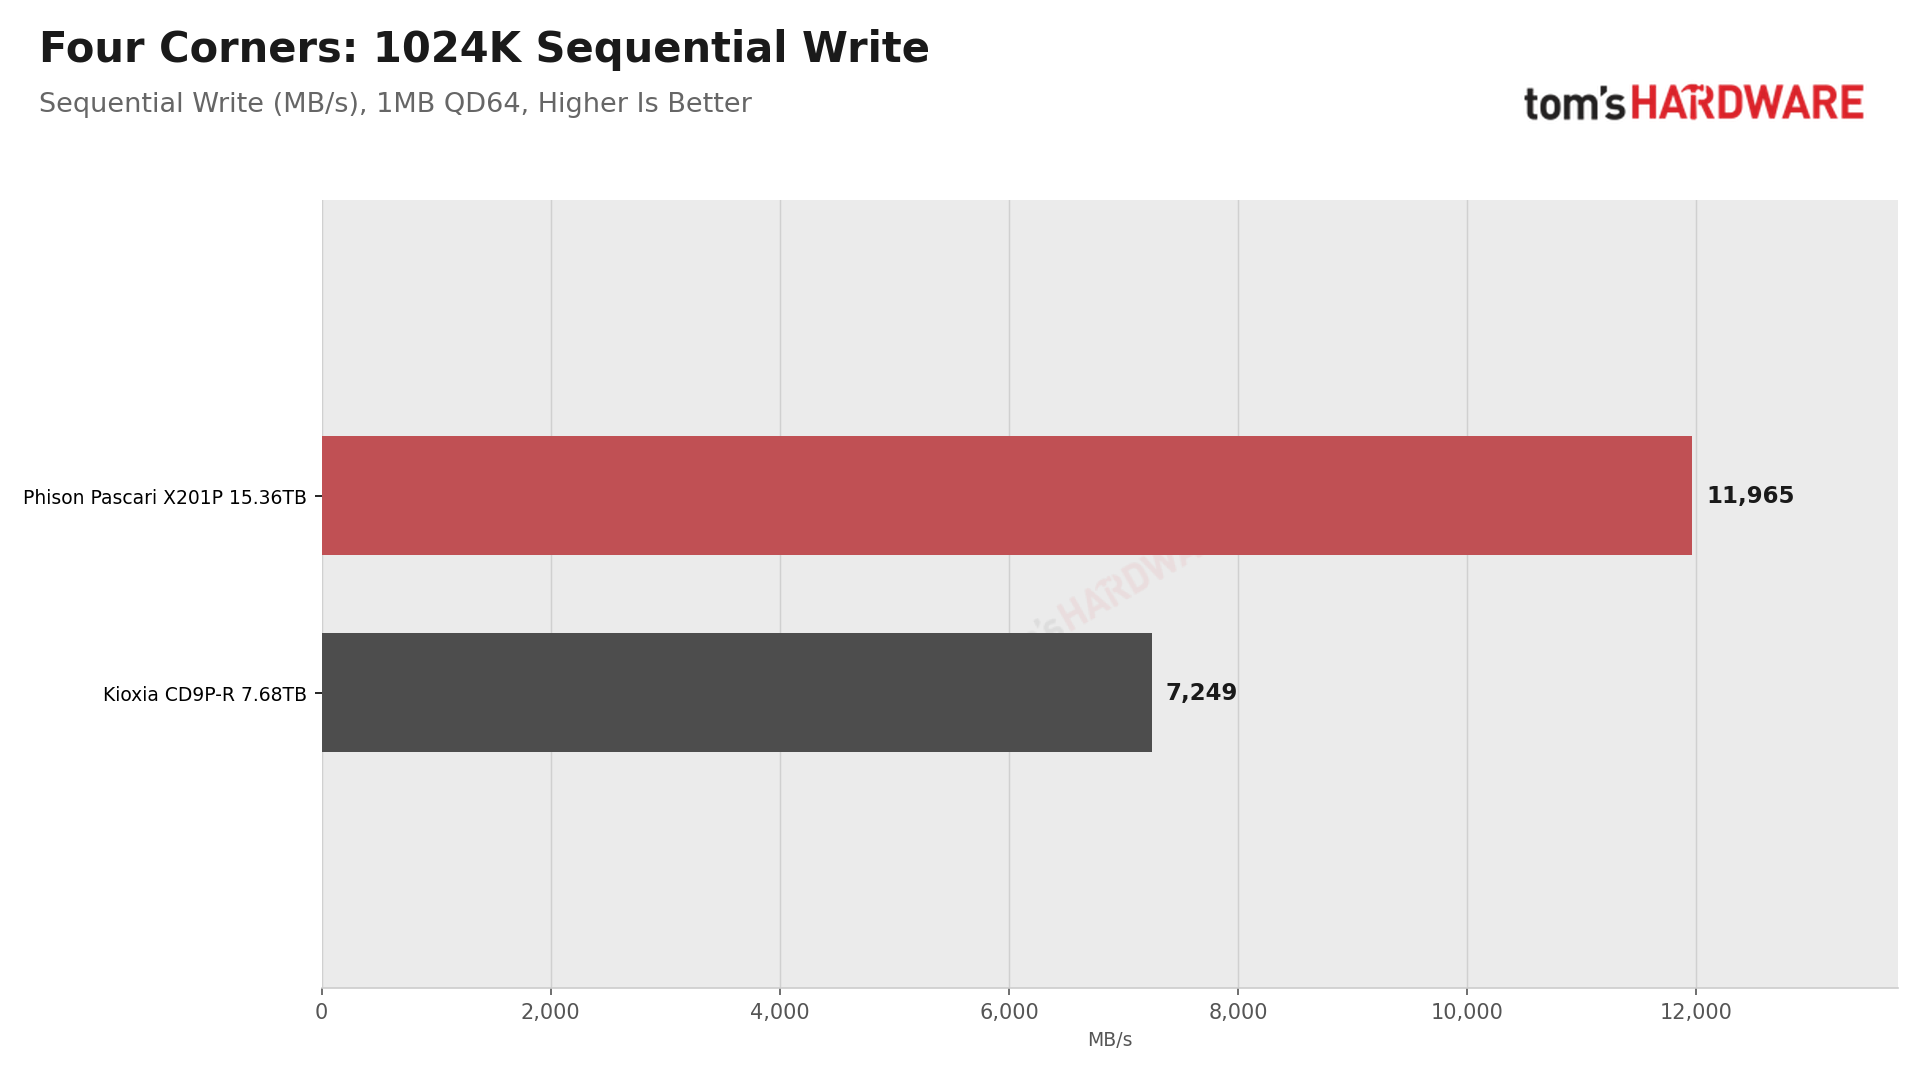
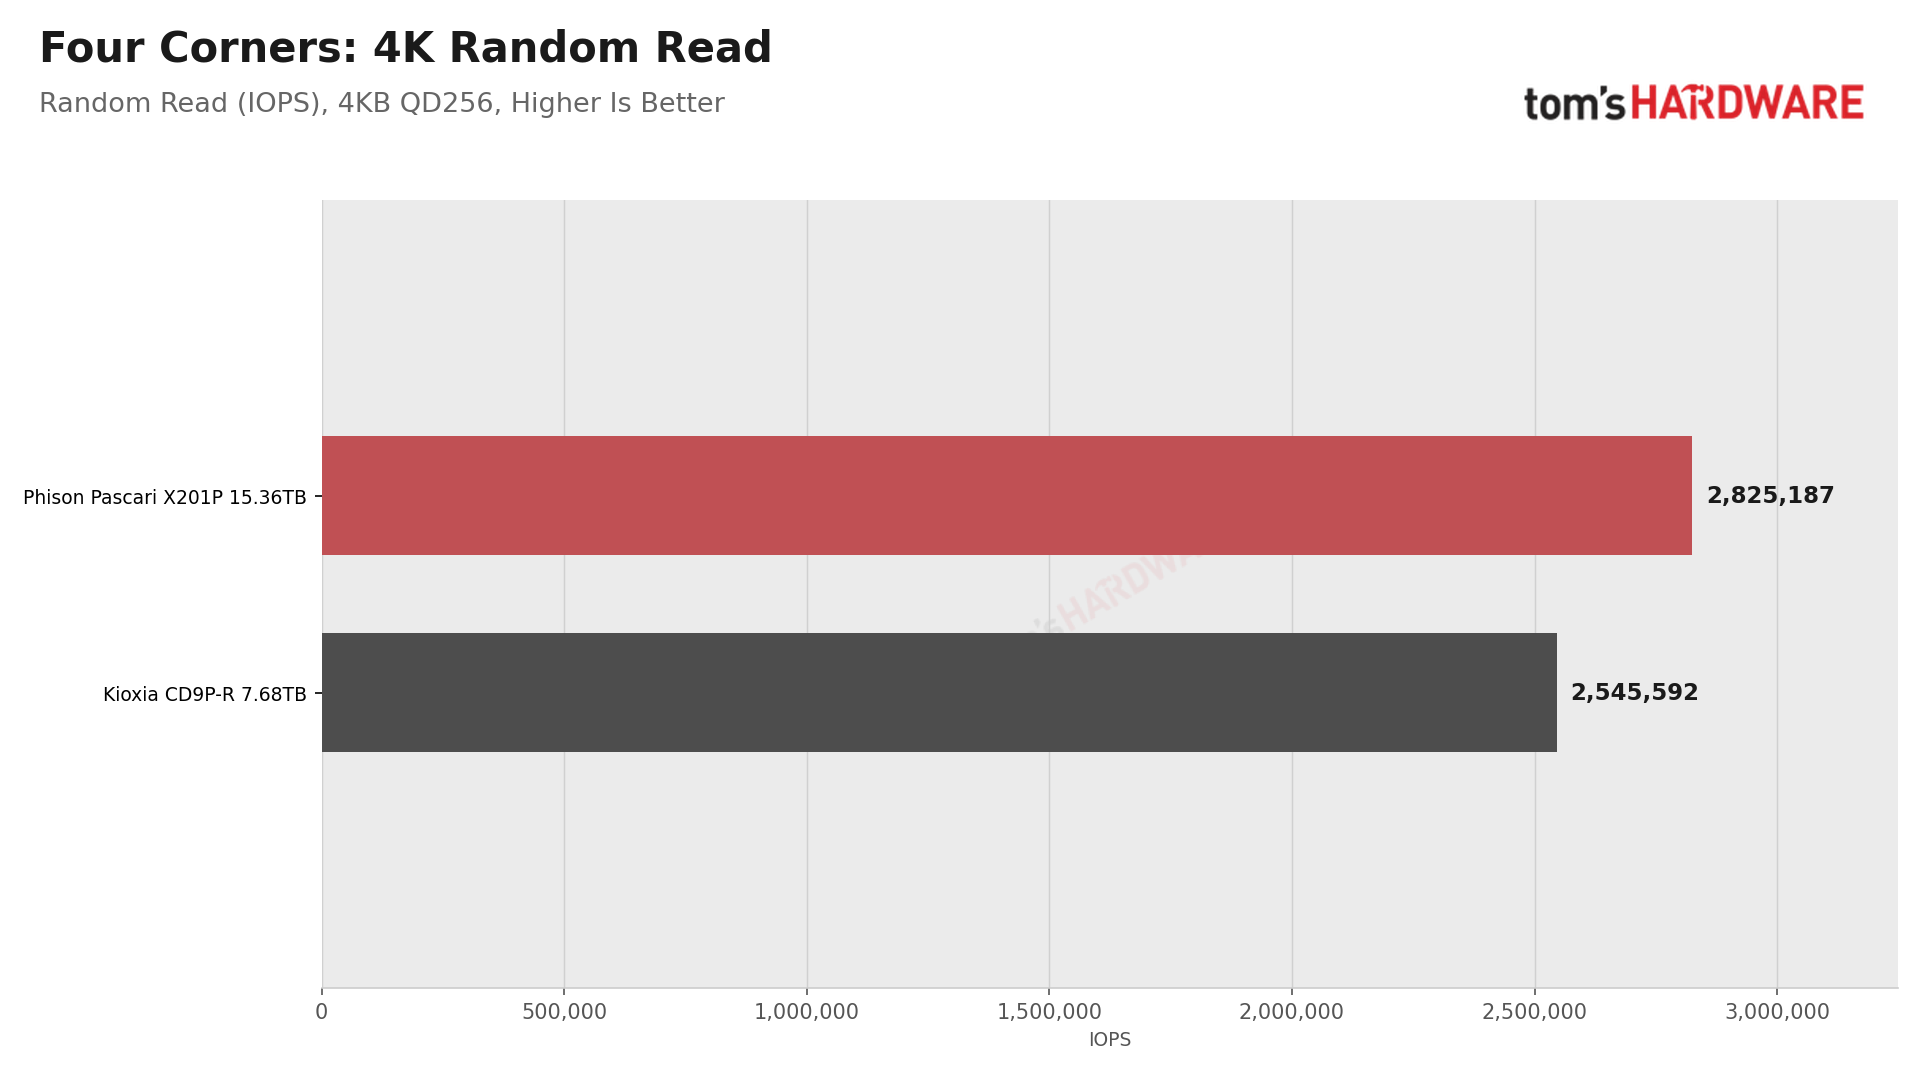
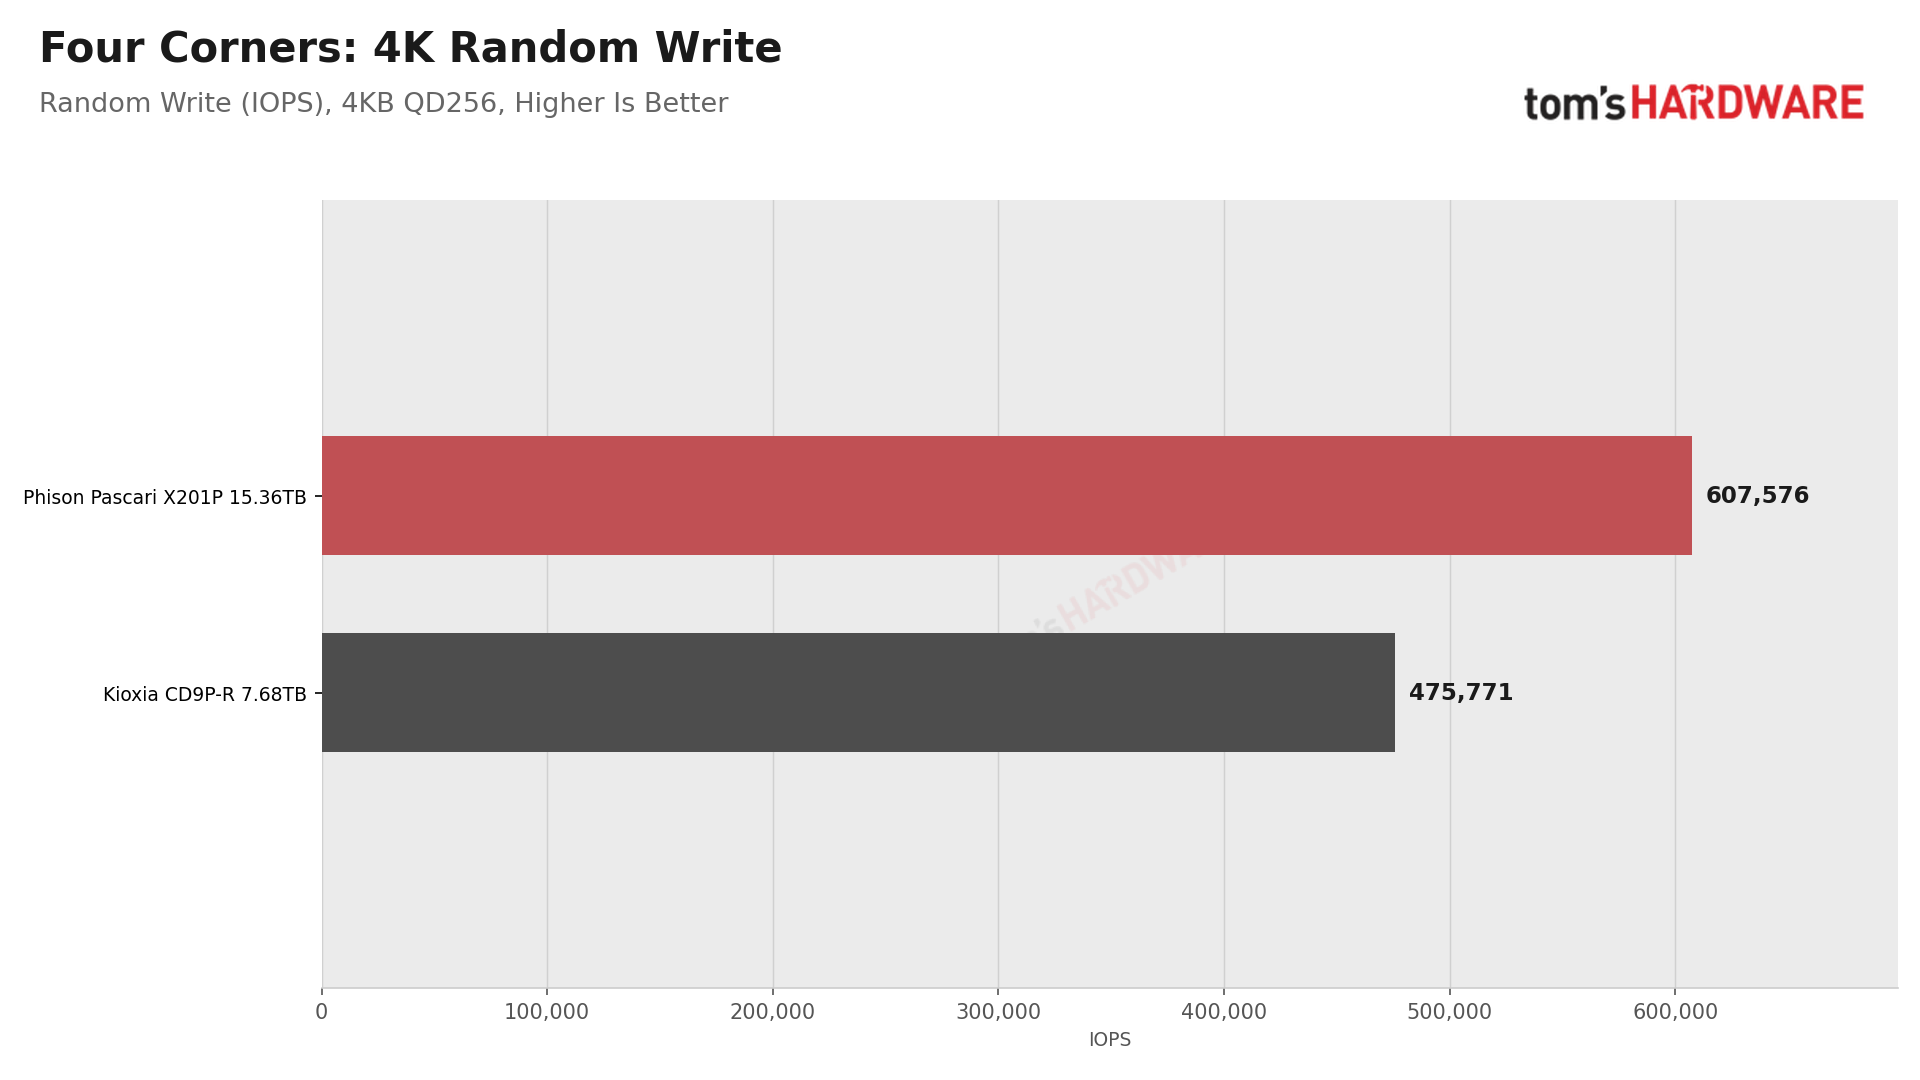
The X201P is about 1.3% over its rating on three of the four corners, and is also ahead of the CD9P-R on three of four. Sequential read is a tie because, again, this is the limit of the PCIe 5.0 interface. The biggest gaps remain the writes: 12 GB/s versus 7.2 GB/s, and 608K versus 476K IOPS.
The random read corner is misleading because our interrupt-driven bench holds the X201P to 2.83 million IOPS, under its 3.25 million rating, but the X201P wins with or without the polling switch. One caveat here is capacity: at a 1:1 7.68TB, the X201P would likely lead less on writes, going by Phison’s own ratings for that model. The repeated 4K random write, hours later, matched the first at 608K IOPS.
Sequential Performance — Queue Depth Sweep
Sequential speed depends significantly on how much work is queued up. A single restore, scan, or file copy may keep only a few requests in flight, while a busy server can build up hundreds. We test 128K and 1MB sequential reads and writes at 11 different queue depths, from QD1 to QD1024, to see where each drive reaches full speed.
Beforehand, we erase the drive and write it end-to-end with 128K sequential writes, because sequential results on a drive full of random data can otherwise swing unpredictably from one queue depth to the next. The 1MB block size matches the transfers in our AI checkpoint and four corners tests.
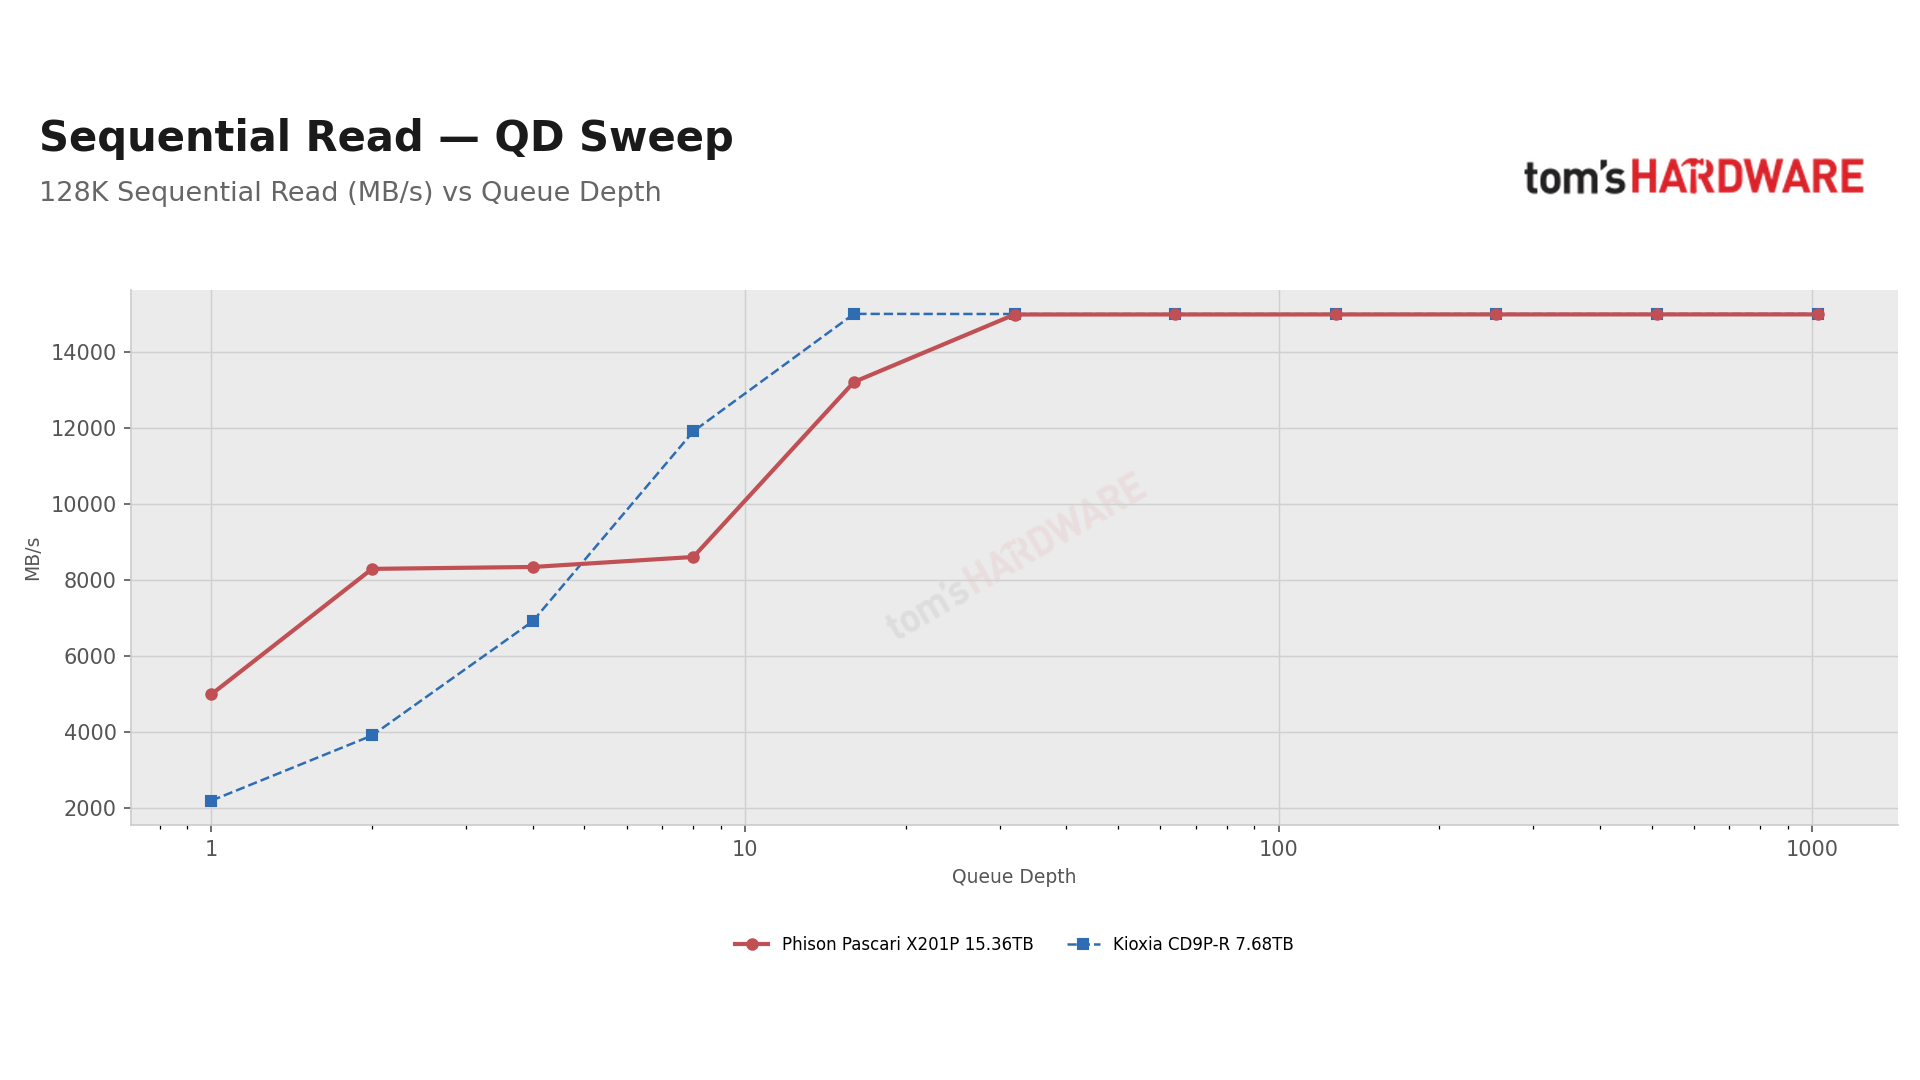
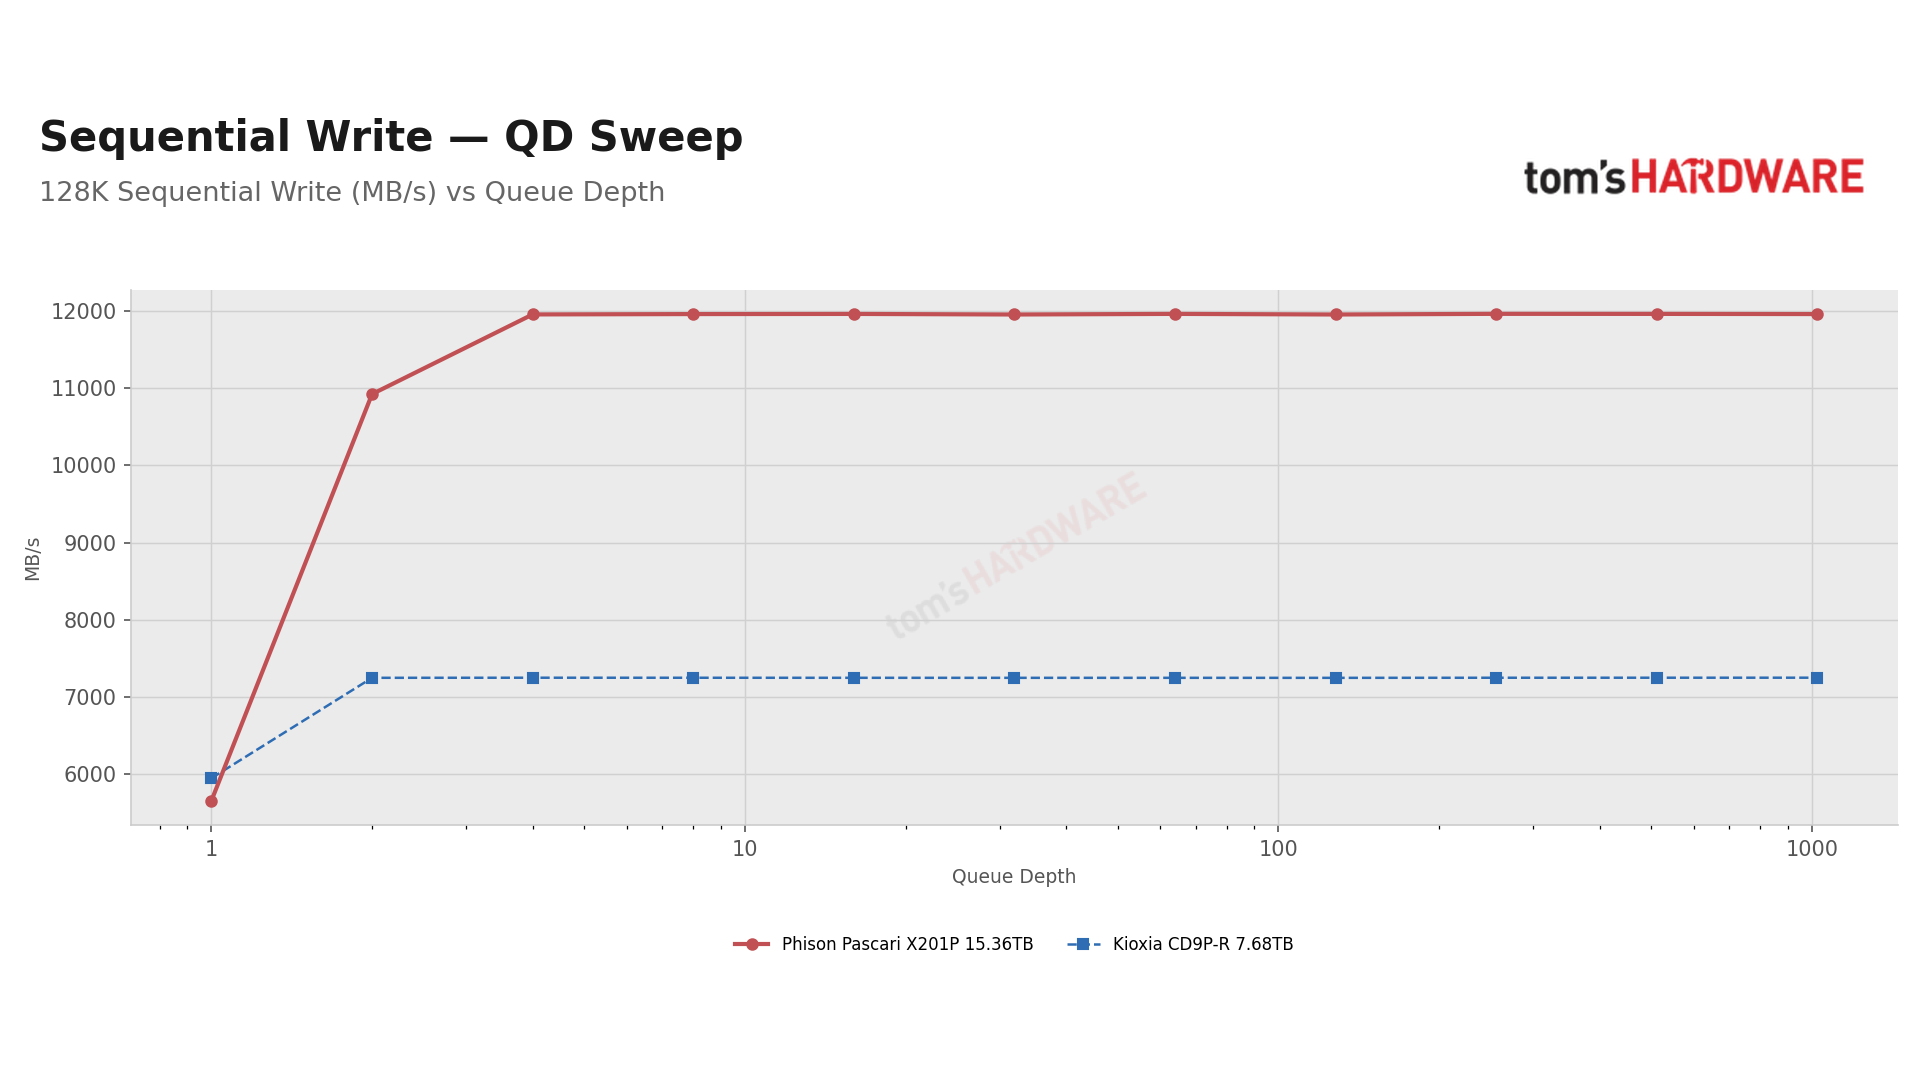
Writes are the X201P’s best sequential result. It reaches full speed, near 12 GB/s, by QD2 with 1MB transfers and by QD4 with 128K, then stays there. That’s 65% faster than the CD9P-R at every depth past QD2.
While both drives top out at the interface limit for sequential read, they get there differently. With a single 128K stream, the X201P reads at 5.0 GB/s, which is more than double the CD9P-R. That may point to read-ahead. After that, the X201P stalls around 8.3 to 8.6 GB/s, from QD2 to QD8, needing QD32 for full speed; Phison’s own data also shows this. The CD9P-R gets full steam by QD16, giving it the edge there and at QD8. At the deeper end with 1MB reads, which the charts don’t show, the X201P holds its full speed where the CD9P-R drops off, by 6% at QD512 and 13% at QD1024.
Random Performance — Queue Depth Sweep
Random performance changes dramatically with load. At QD1, with one request at a time, the result reflects the latency that single-threaded and latency-sensitive software feels most. At high queue depths, it shows how much work the drive can absorb from many users and jobs at once.
We test 4K and 8K random reads and writes at 13 different queue depths, from QD1 to QD4096, with the drive at steady state. 4K matches the default block size of common file systems and the mapping unit most SSDs use internally, while 8K is a common database page size. Deep queues are spread across up to eight fio jobs, since a single job can't keep up with faster drives. At the top of the 4K read curve, our bench levels off near 2.8 million IOPS, so a drive that reaches it may have more to give.
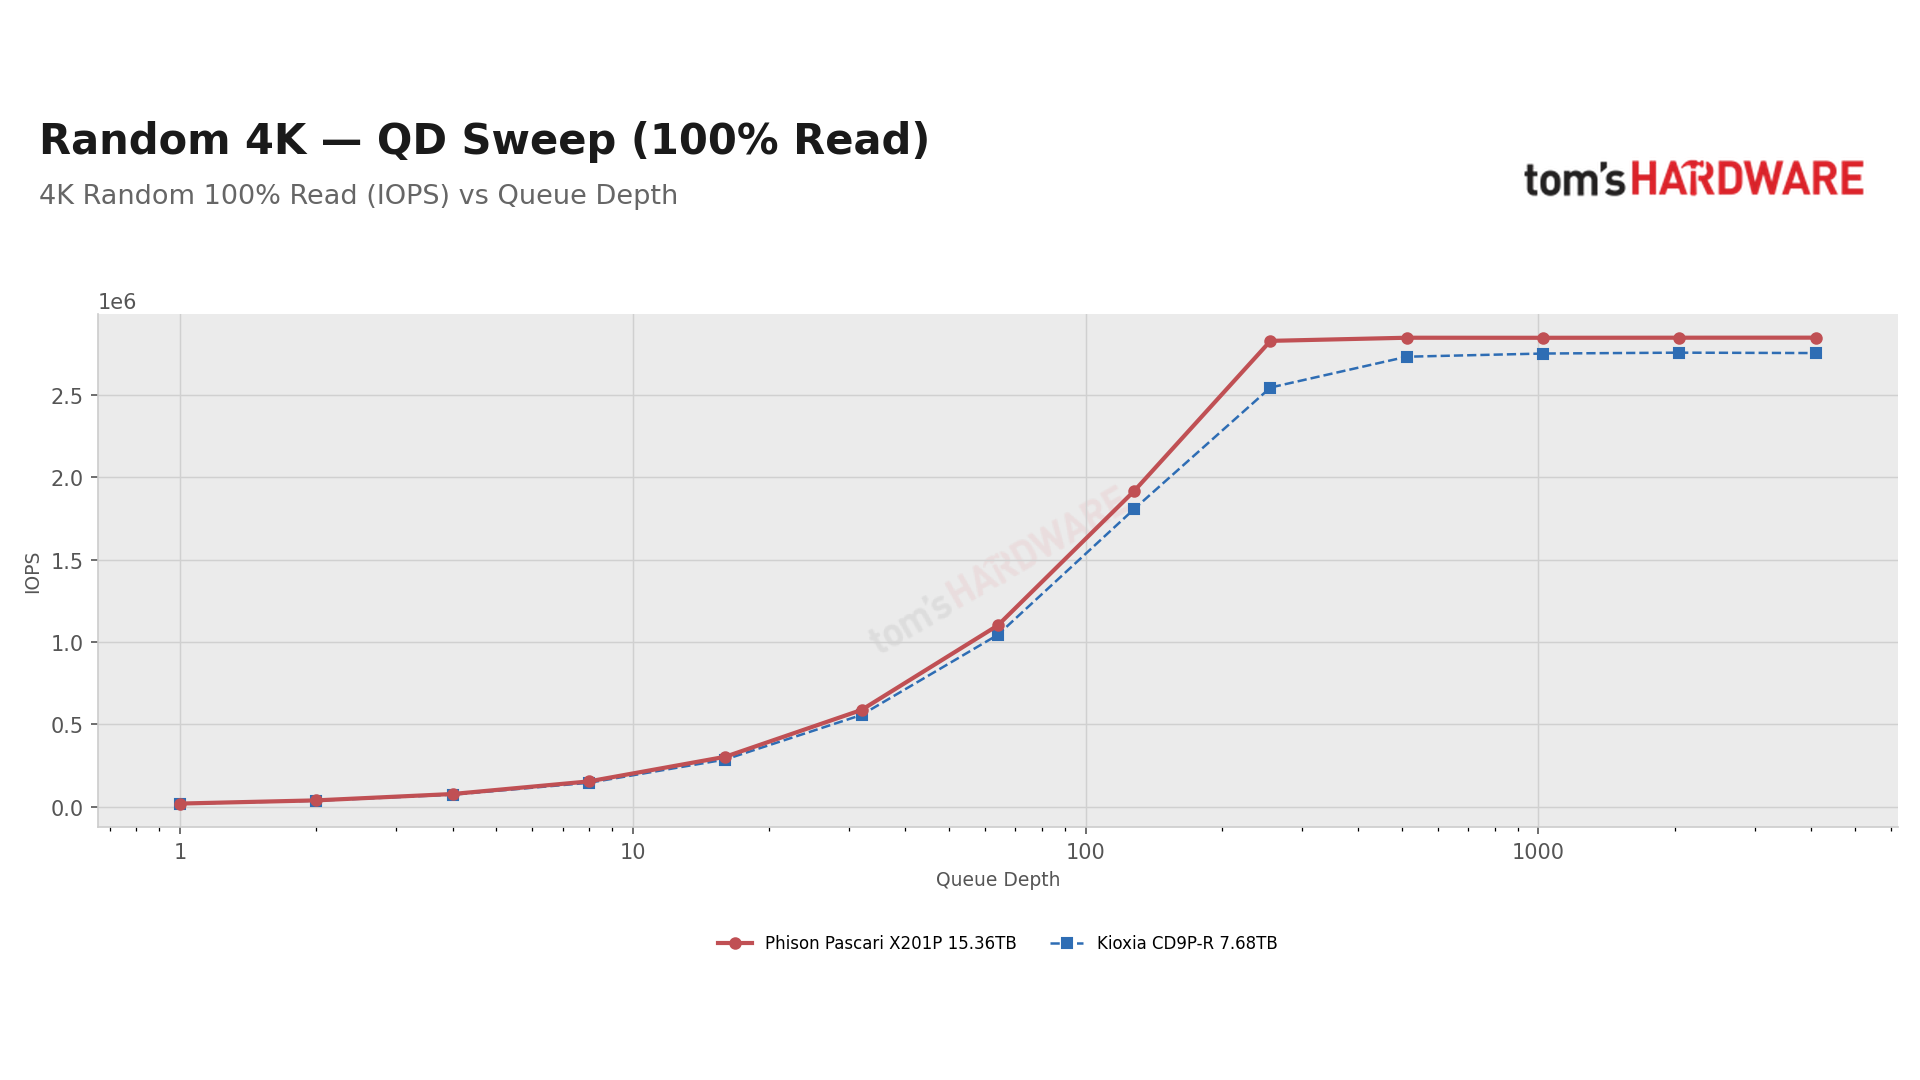
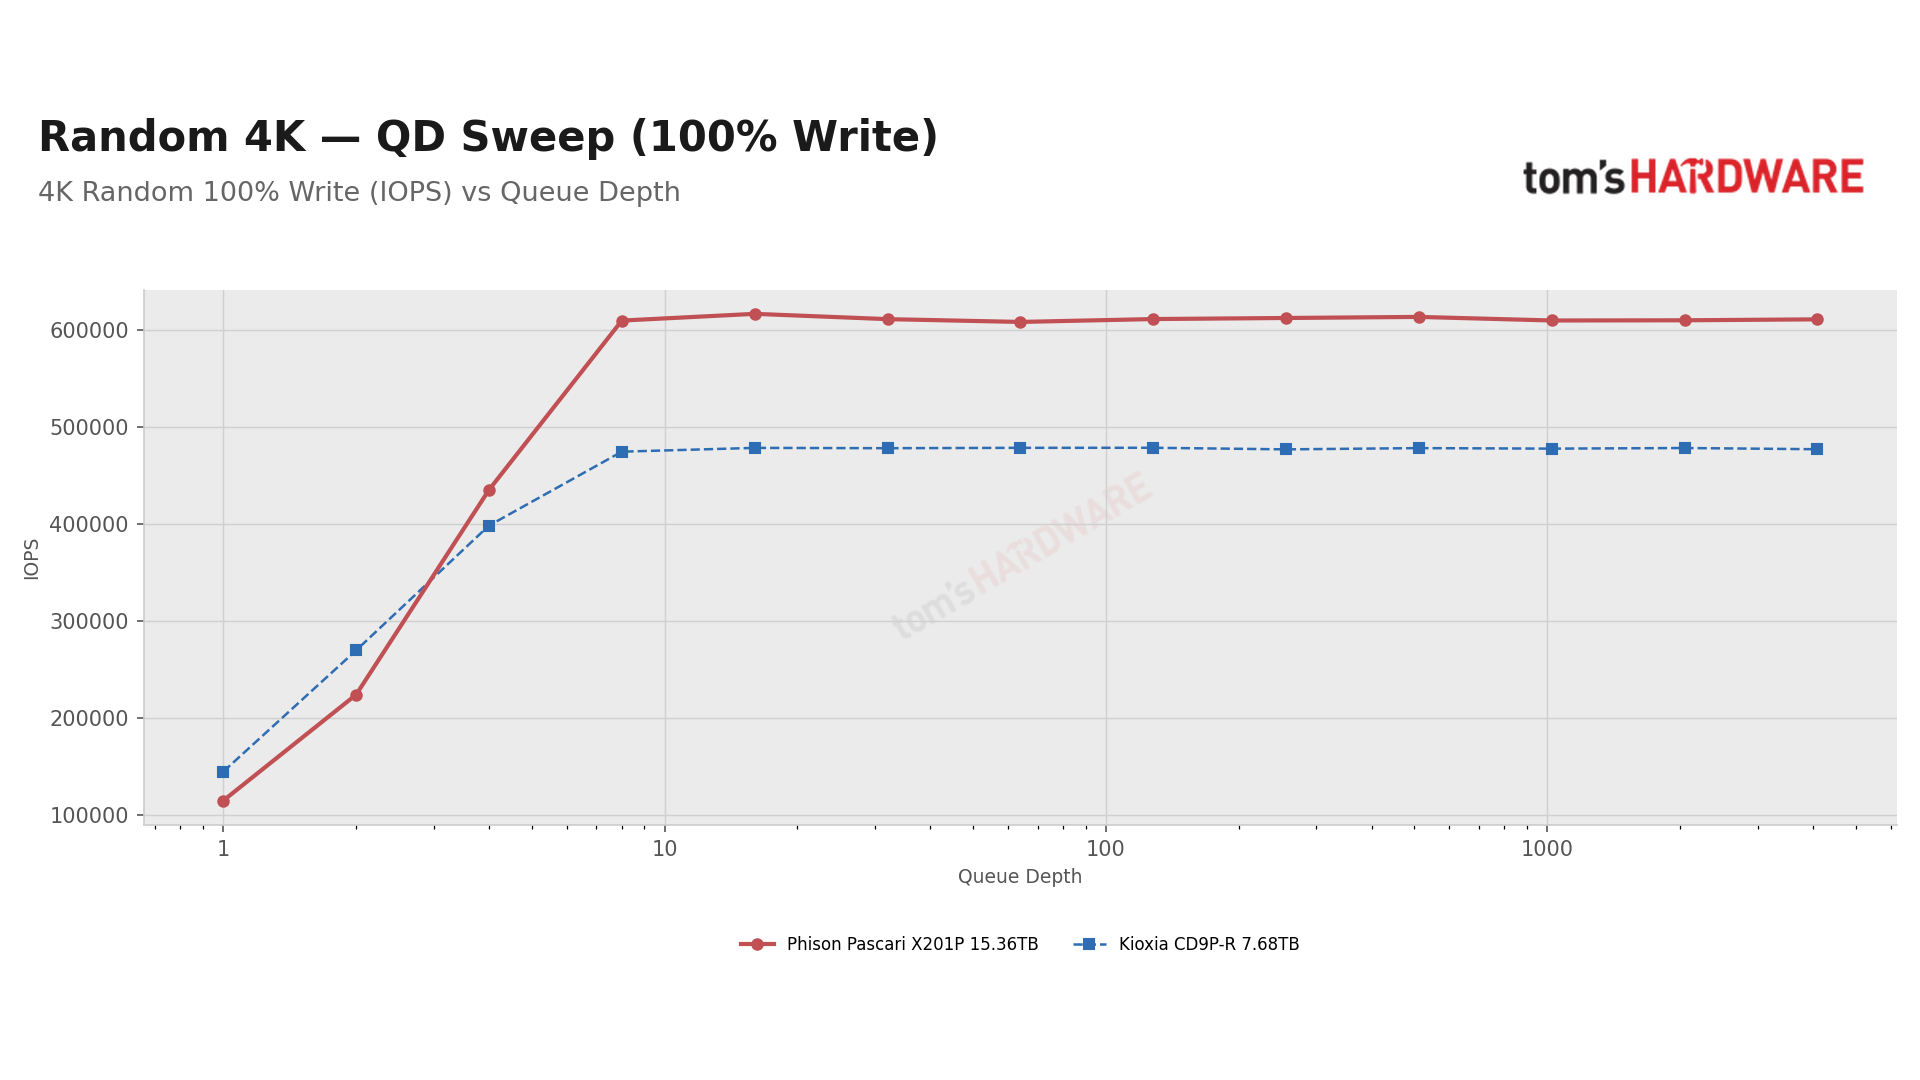
The X201P reads faster than the CD9P-R at every 4K queue depth, by about 6% until the queues get deeper, and eventually its read curve flattens at 2.85 million IOPS because that’s where our bench, not the drive, tops out.
Writes, on the other hand, split in two. At QD1 and QD2, the CD9P-R is the quicker drive, by 26% and 20%, respectively. At QD1, that’s 114K IOPS at 7.7 µs for the X201P against 144K at 5.8 µs, and the X201P’s figure is still inside Phison’s 8 µs rating. From QD4, the X201P takes the lead, reaching its write ceiling at QD8 with about 610K IOPS and holding it through QD4096, which is 28% above what the other drive can deliver. The 4K write result at QD32 is one of the three points we re-tested.
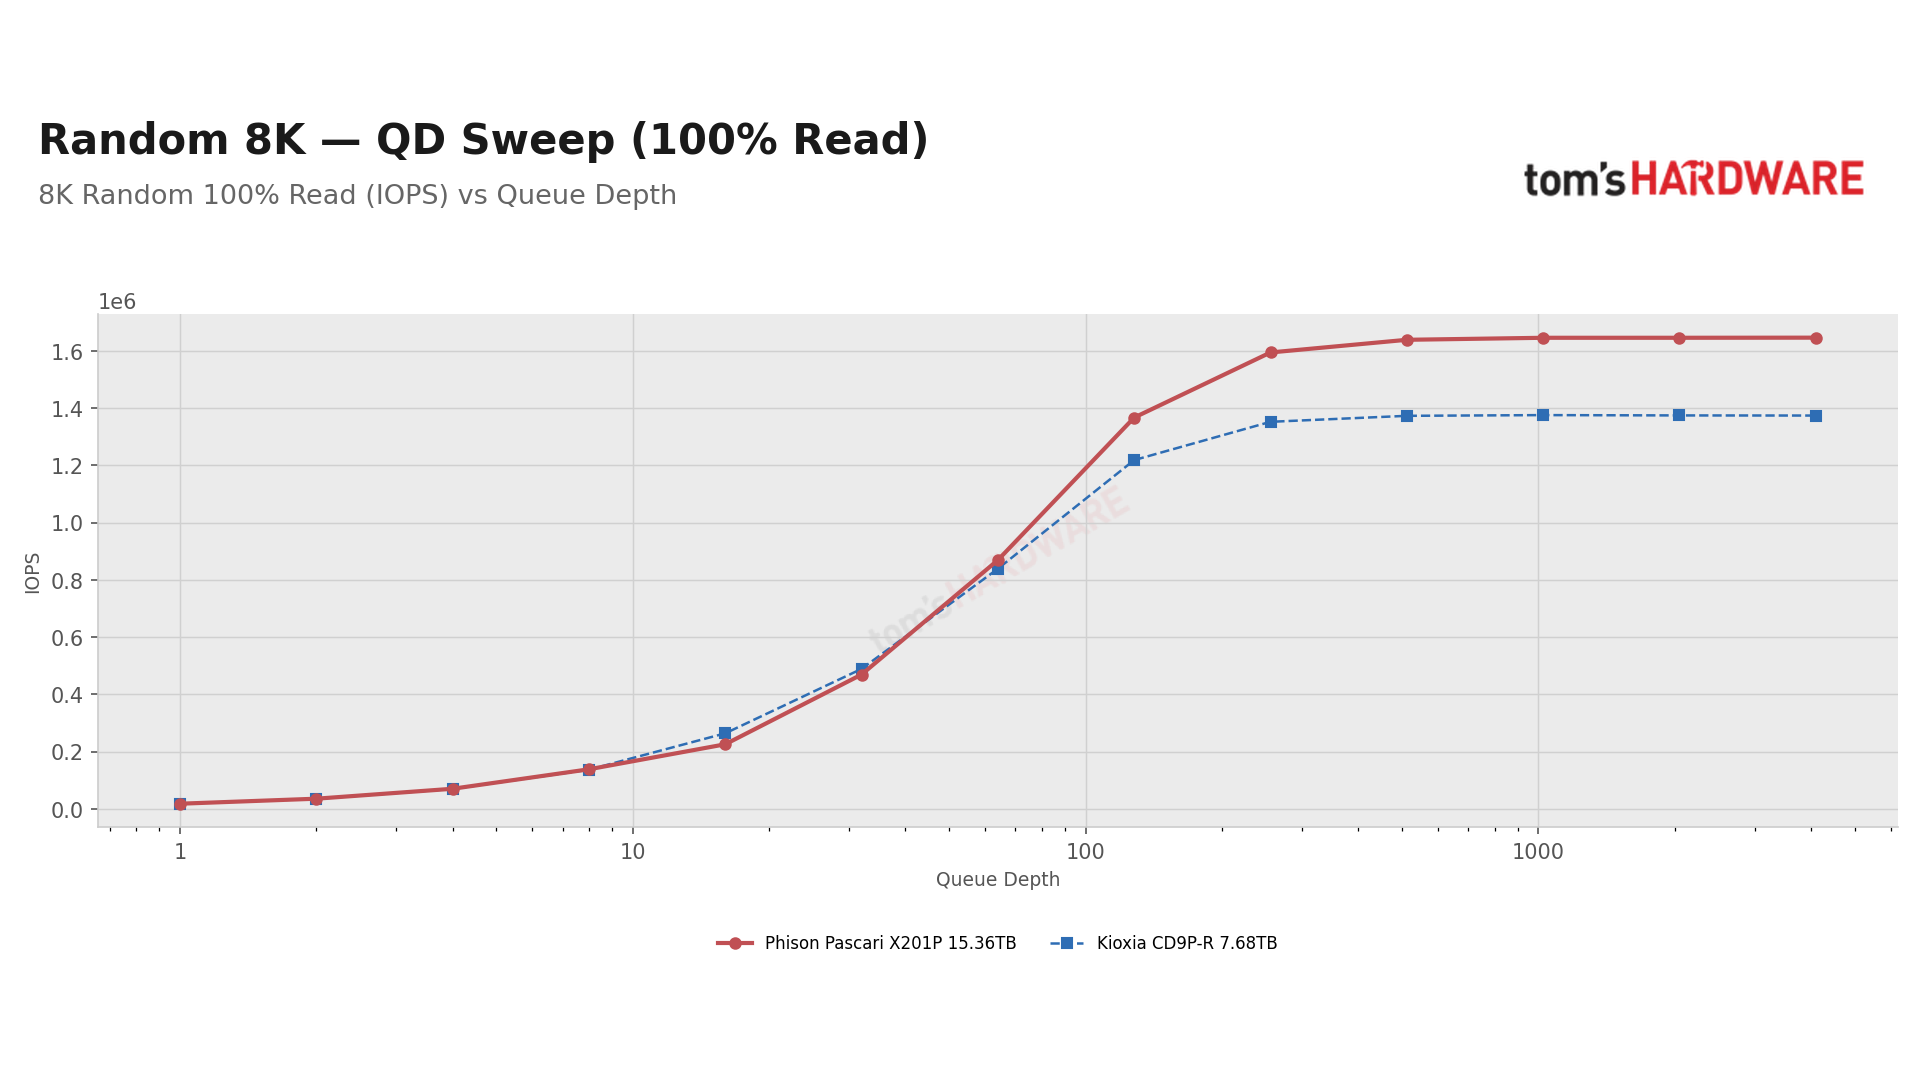
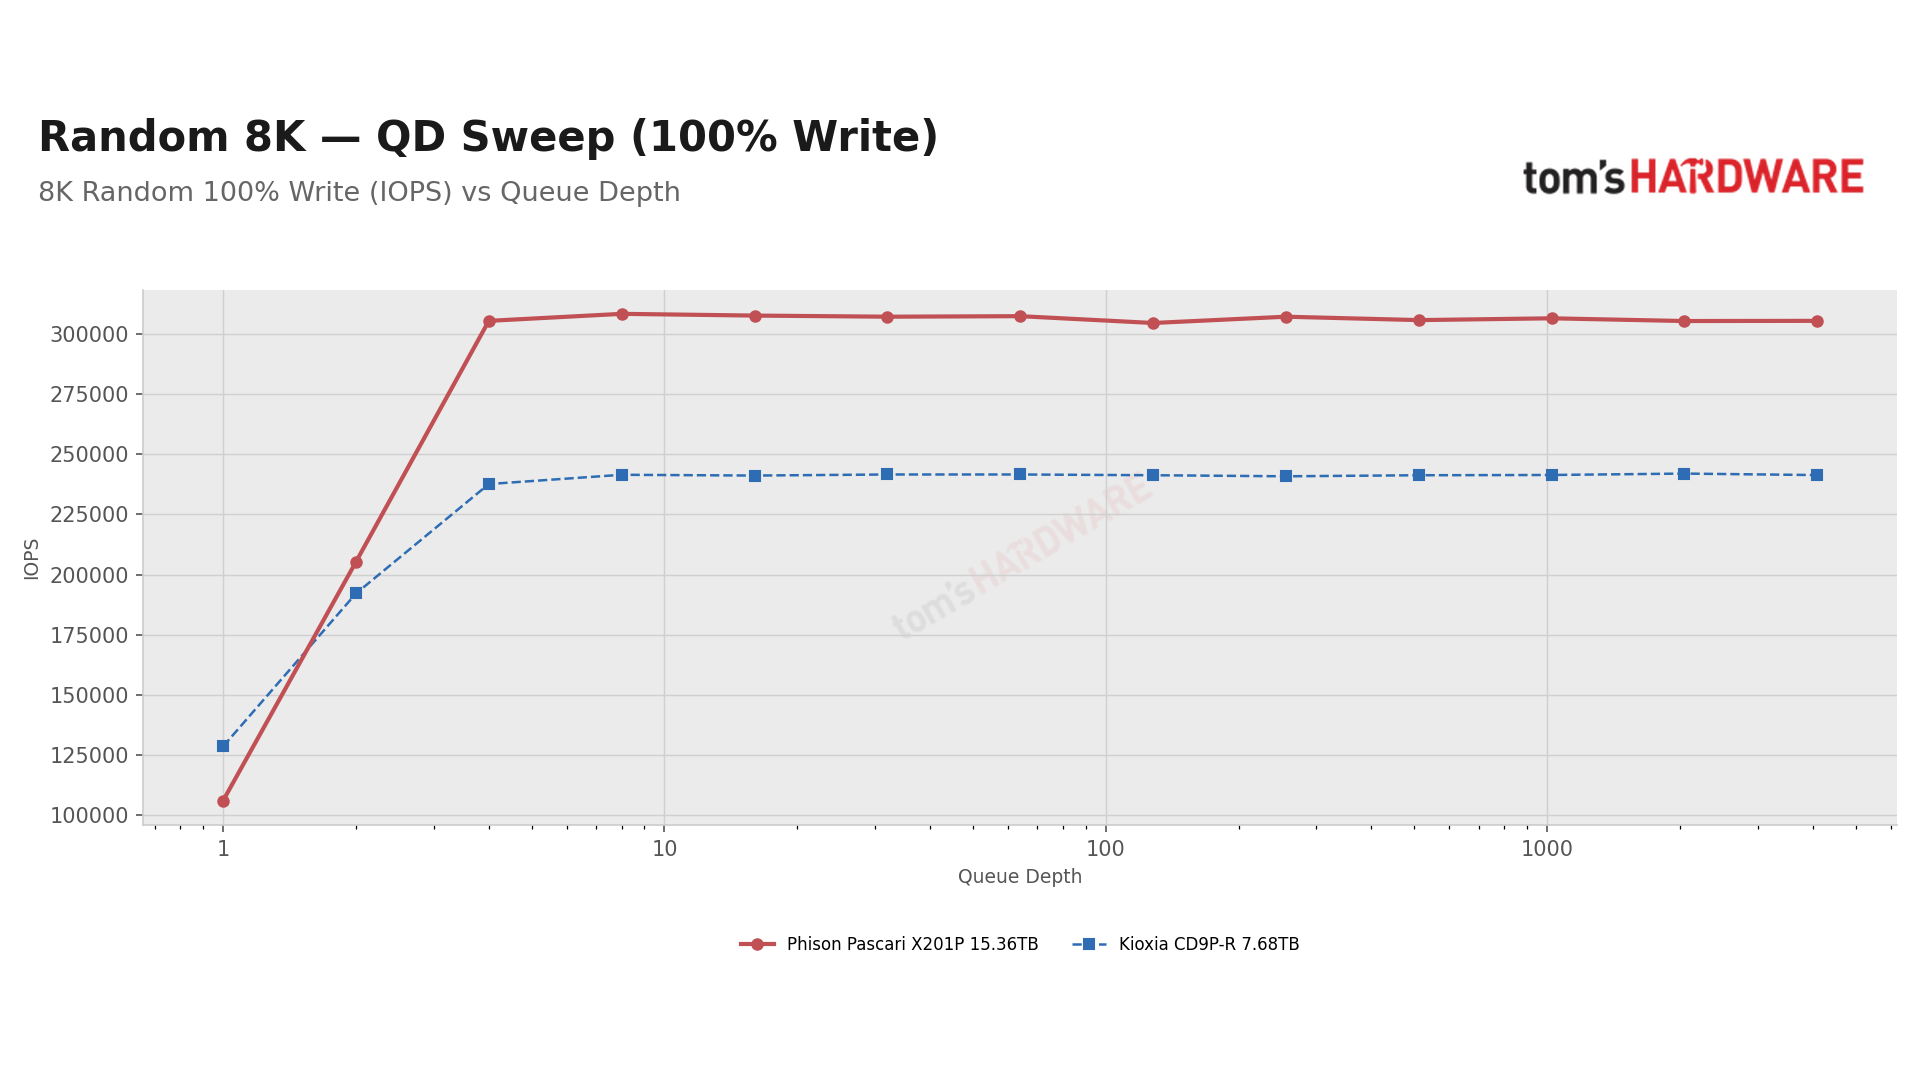
At 8K, a common database page size, the X201P has one notable soft spot: its reads slow down around QD16, where the CD9P-R leads by 17%, before the X201P pulls away for a 20%-higher peak.
Random Performance — Drive Limit (Polled)
Our main results use interrupt-driven I/O because that is how most server software runs. In that mode, our bench levels off near 2.8 million 4K random read IOPS, and the host adds a little time to every request, which shows most at QD1. To see what the drive itself can do, we repeat three tests with polled I/O, where fio checks for finished requests in a tight loop instead of waiting for the drive to signal: 4K random reads at QD1024 (eight jobs at QD128 each), plus 4K random reads and writes at QD1.
Polling keeps a CPU core fully busy for each job, which few applications can afford, so treat these numbers as the drive’s ceiling rather than what a typical server will see. Some vendors measure their own figures this way, so these are the results to compare against a spec sheet.
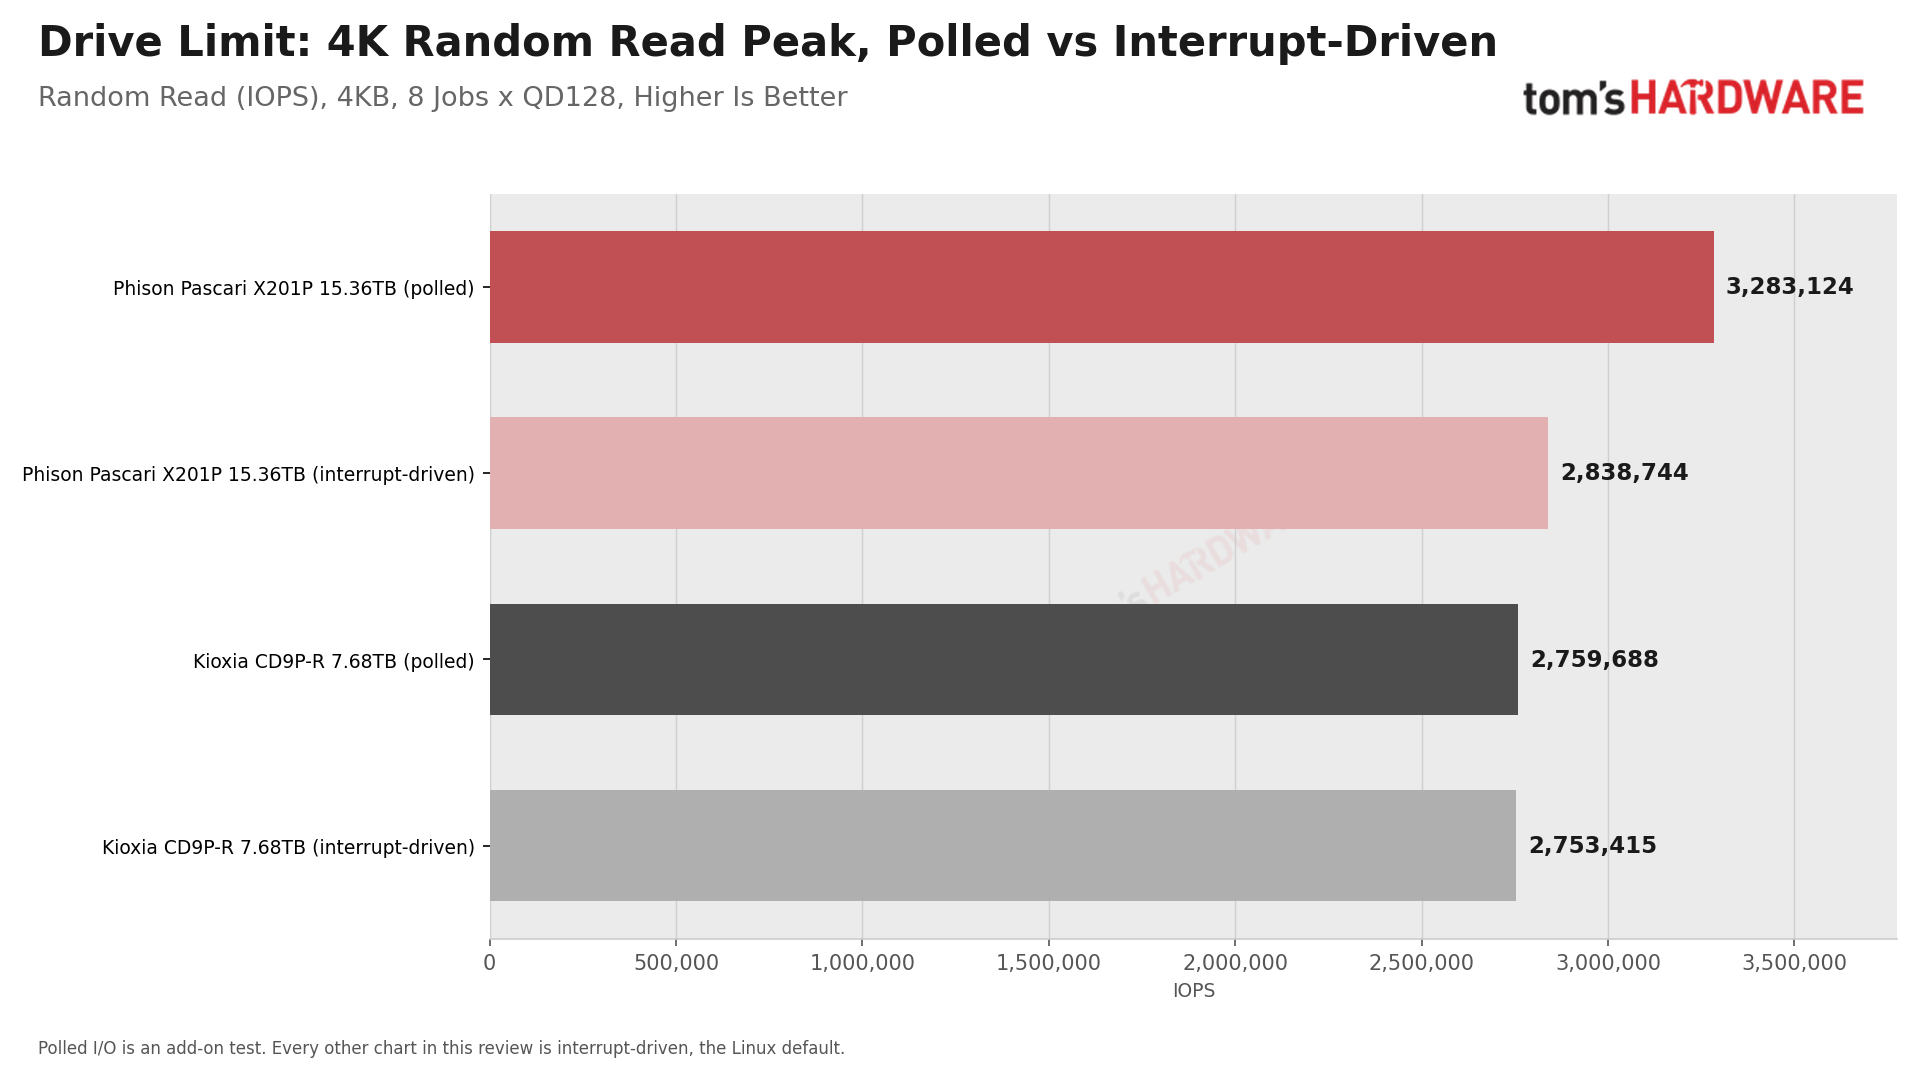
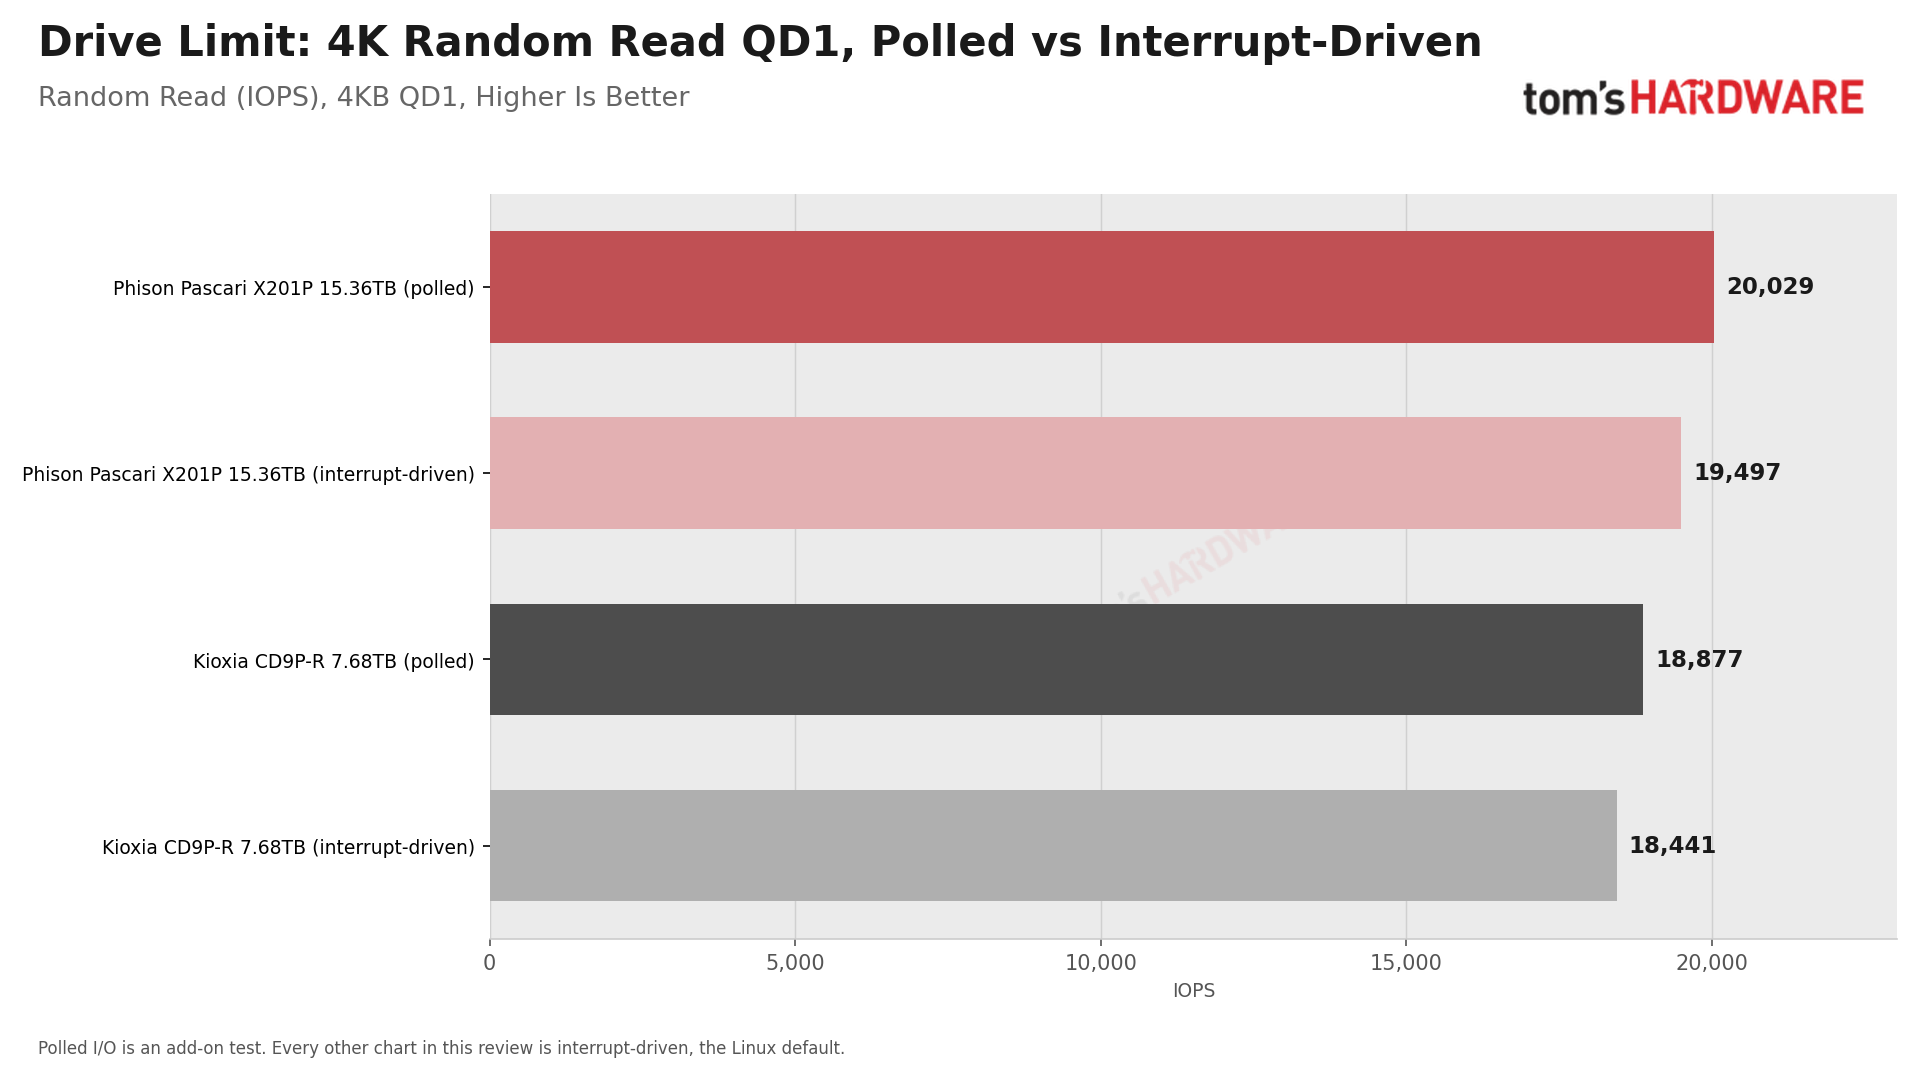
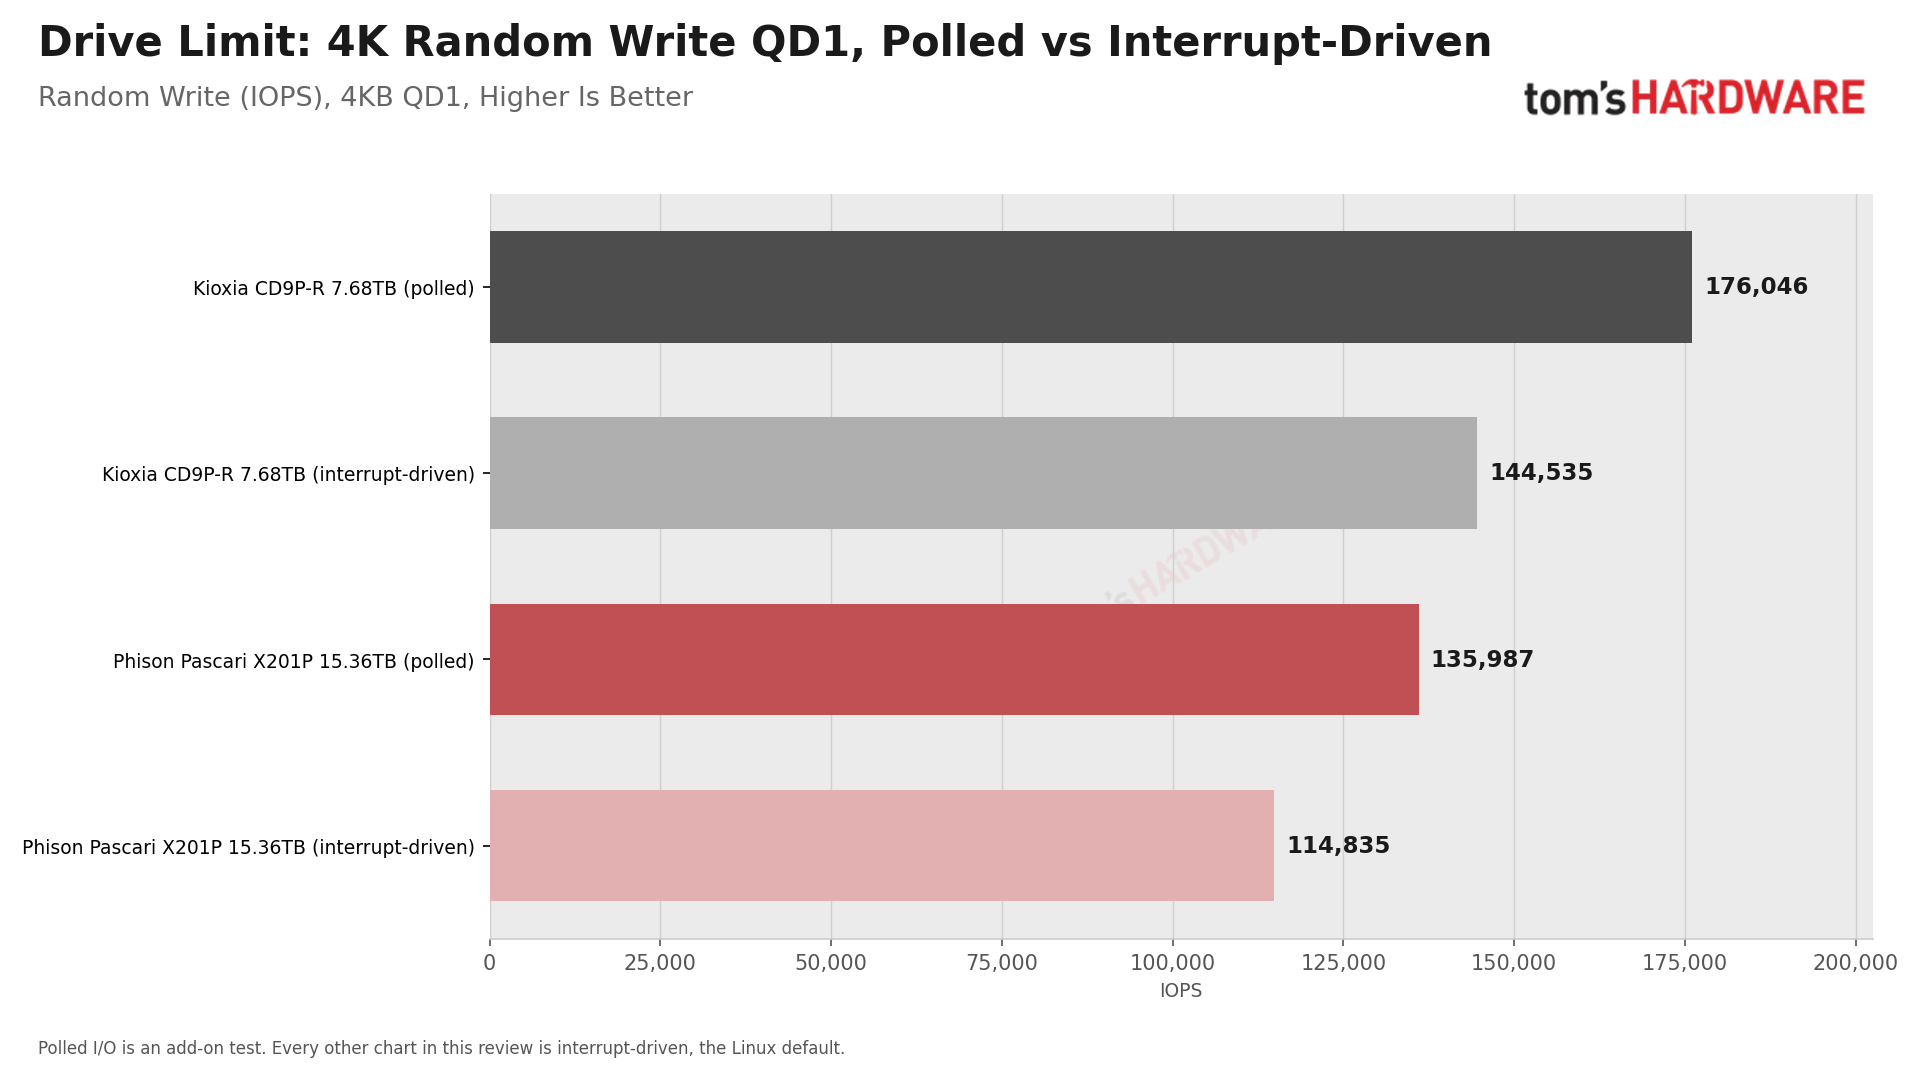
Switching to polling matters more for the X201P than it does for the CD9P-R, as the latter isn’t held back by our bench. The X201P, which is, can deliver 3.28 million IOPS with polling, and just 2.84 million — the bench limit — without. Our figure is 1% over Phison’s rating and within 0.2% of Phison’s own test data, so the rating is real, and the interrupt-driven charts understate its performance by about 13%. This takes its lead over the CD9P-R in this benchmark from 3% to 19%. Polling also helps QD1 write performance, which buffs the X201P by 18%, but the CD9P-R benefits as well, staying ahead.
Random Performance — Block Size Sweep
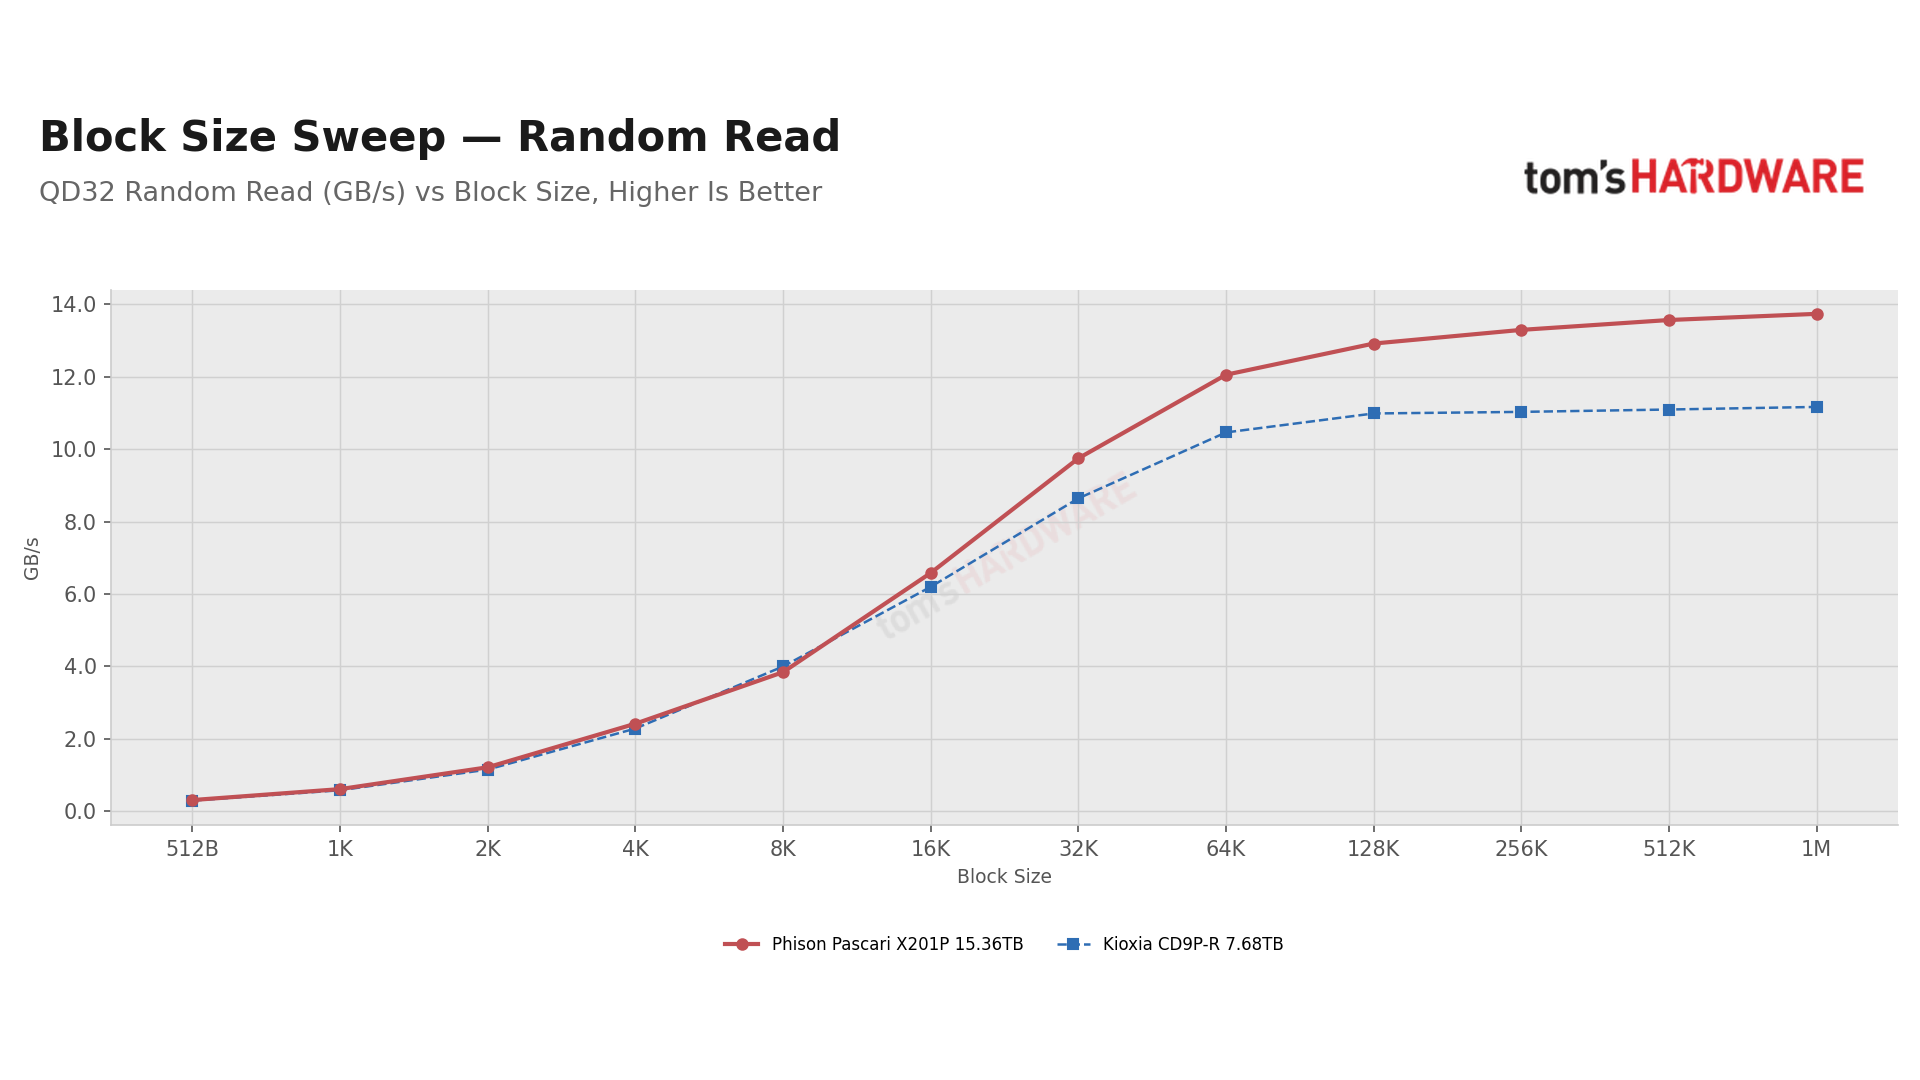
Not every application uses 4K transfers. Real workloads mix small metadata updates with large reads and writes, and drives may handle the extremes very differently. We test random reads and writes at 12 different block sizes from 512 bytes to 1MB, all at QD32, plus 512-byte reads at QD256, where small reads aren't held back by the shallower queue.
Writes smaller than a drive's internal mapping unit force it to read, modify, and rewrite a larger chunk, which shows up as a sharp drop below that size. Large blocks, on the other hand, reveal the drive's bandwidth ceiling. We format drives to 512-byte sectors when they support it, so the sweep can issue 512-byte transfers; drives that don’t are marked unsupported below 4K.
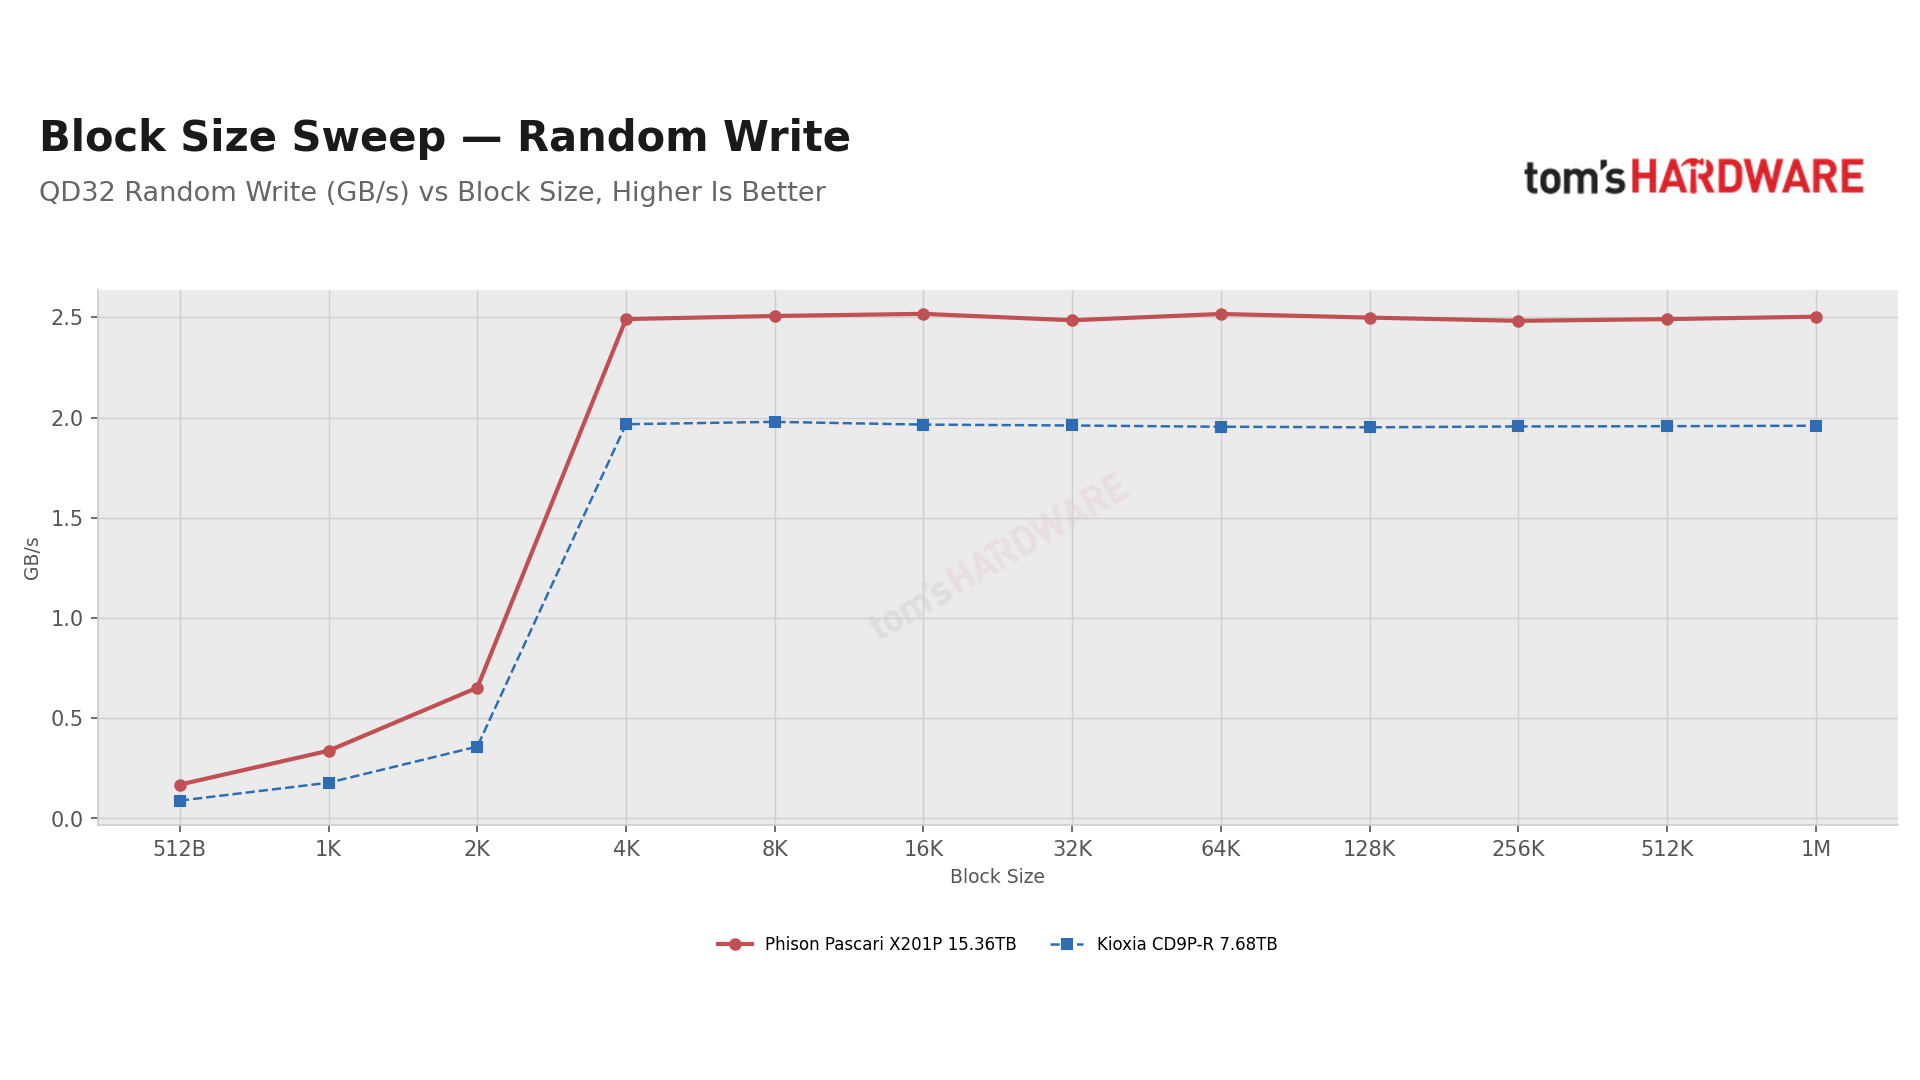
Put simply: the X201P handles writes smaller than 4K far better than the CD9P-R. It still slows down when handling writes smaller than 4K, at a little over half its 4K rate, but at 319-330K IOPS versus the CD9P-R’s 174K. From 4K up, its random write bandwidth sits near 2.5 GB/s regardless of the block size, versus 2.0 GB/s. The sub-4K gap is only relevant to software that issues such writes to a 512-byte format.
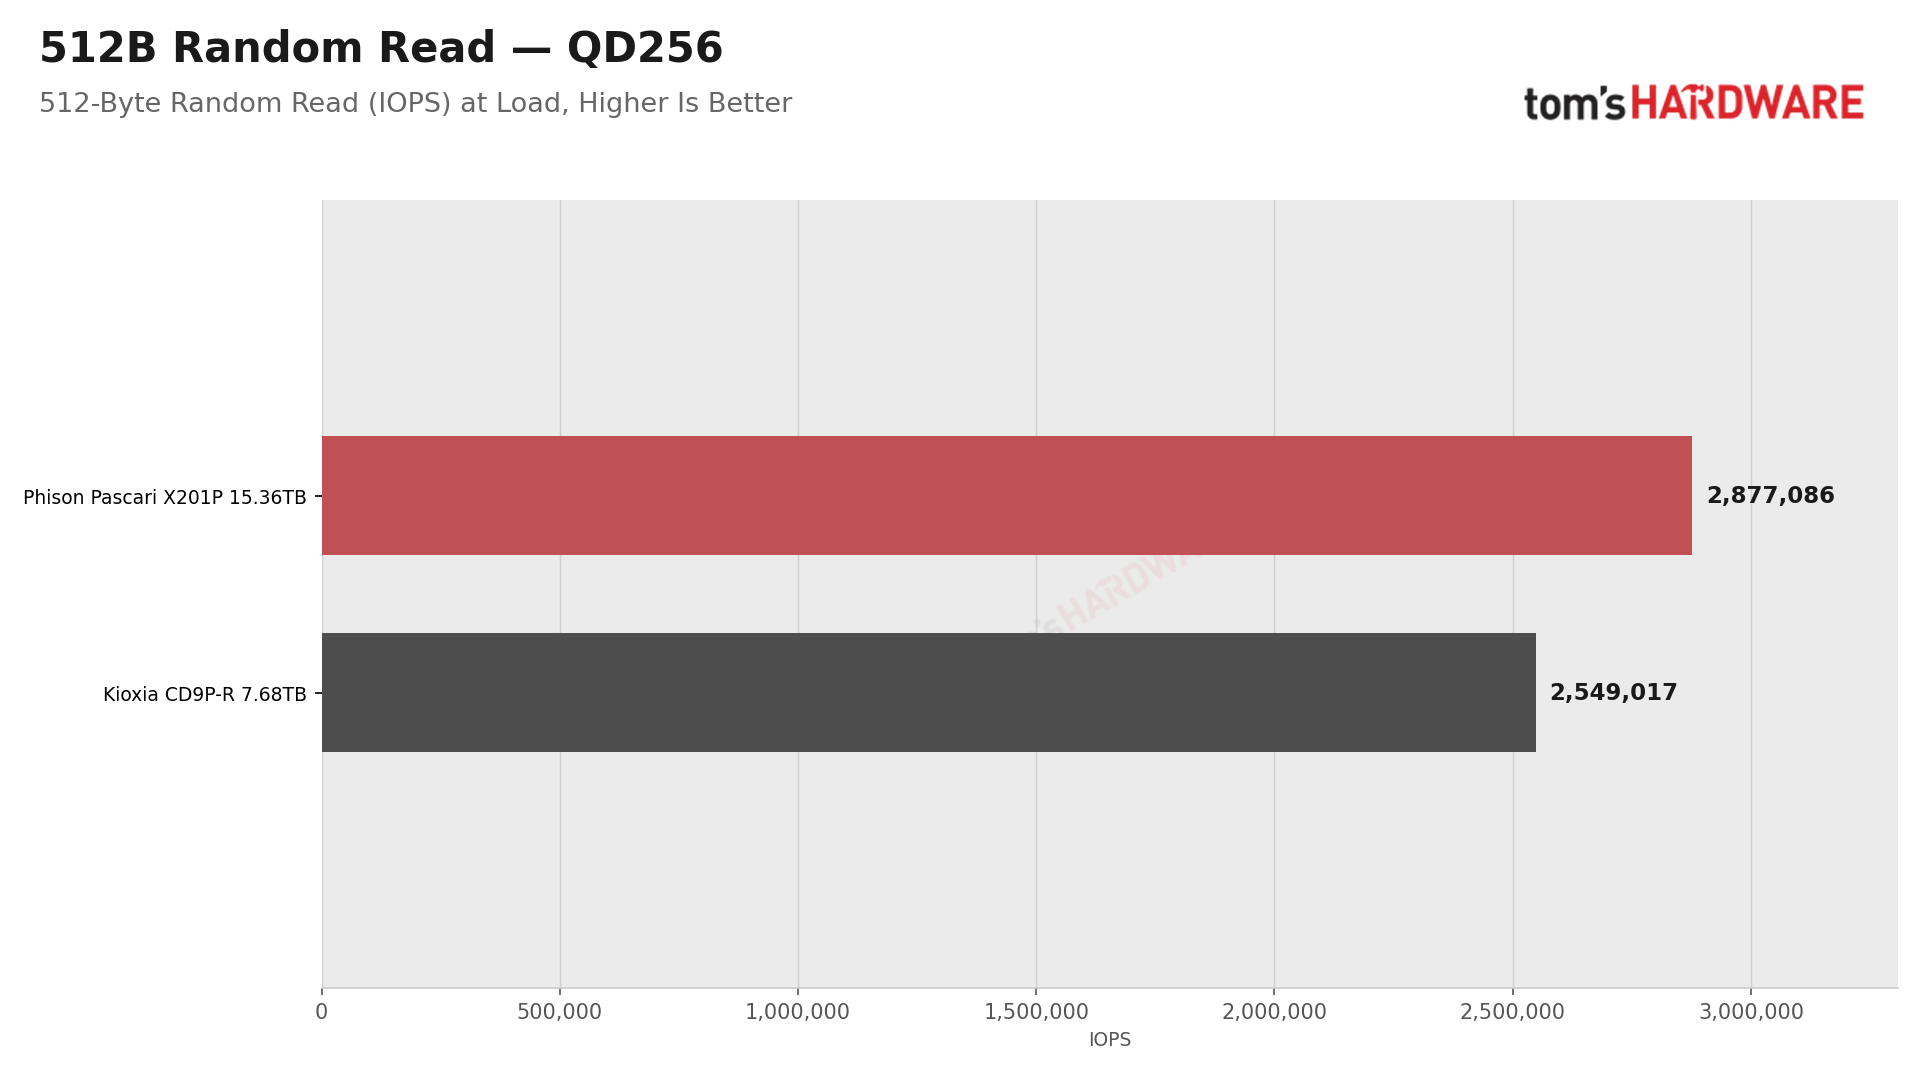
Small reads cost nothing extra on either drive. At QD256, 512-byte reads reach 2.88 million IOPS on the X201P, our bench’s ceiling again, against 2.55 million. Large random reads climb to 13.7 GB/s on the X201P, which is 18-23% over the CD9P-R, but neither drive hits the interface limit. The X201P trails only on 8K reads, by 4%, the same soft spot as in the queue depth sweep.
Mixed Workloads — Read/Write Mix Sweep
Most real workloads mix reads with writes, and even a modest share of writes can slow reads down as they wait behind flash programming and garbage collection. We test six read/write mixes, from 95% reads to 95% writes, at 4K and 8K and at 13 separate queue depths from QD1 to QD4096. The ratios include those in SNIA's enterprise performance test specification, plus 70/30, a long-standing stand-in for transactional database work. The charts show total IOPS, reads and writes combined, so you can see how quickly throughput falls as the write share grows.
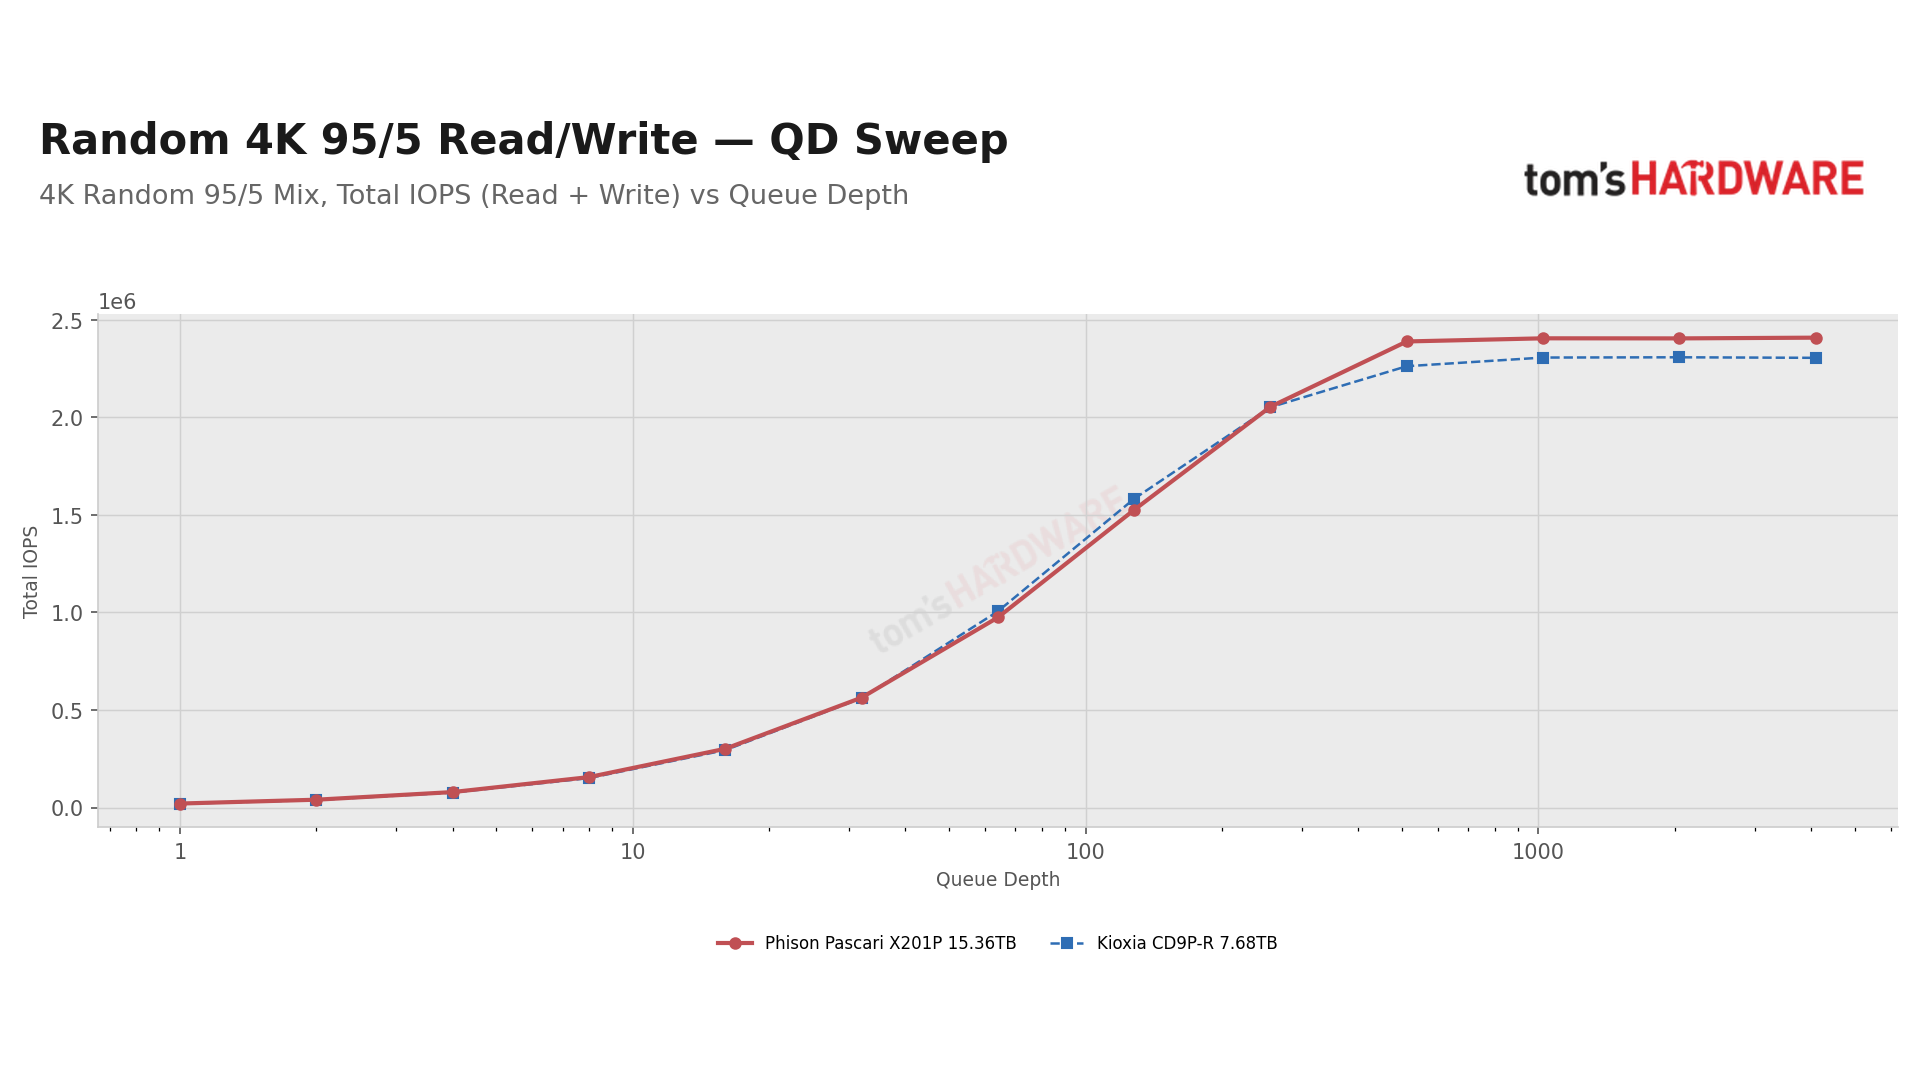
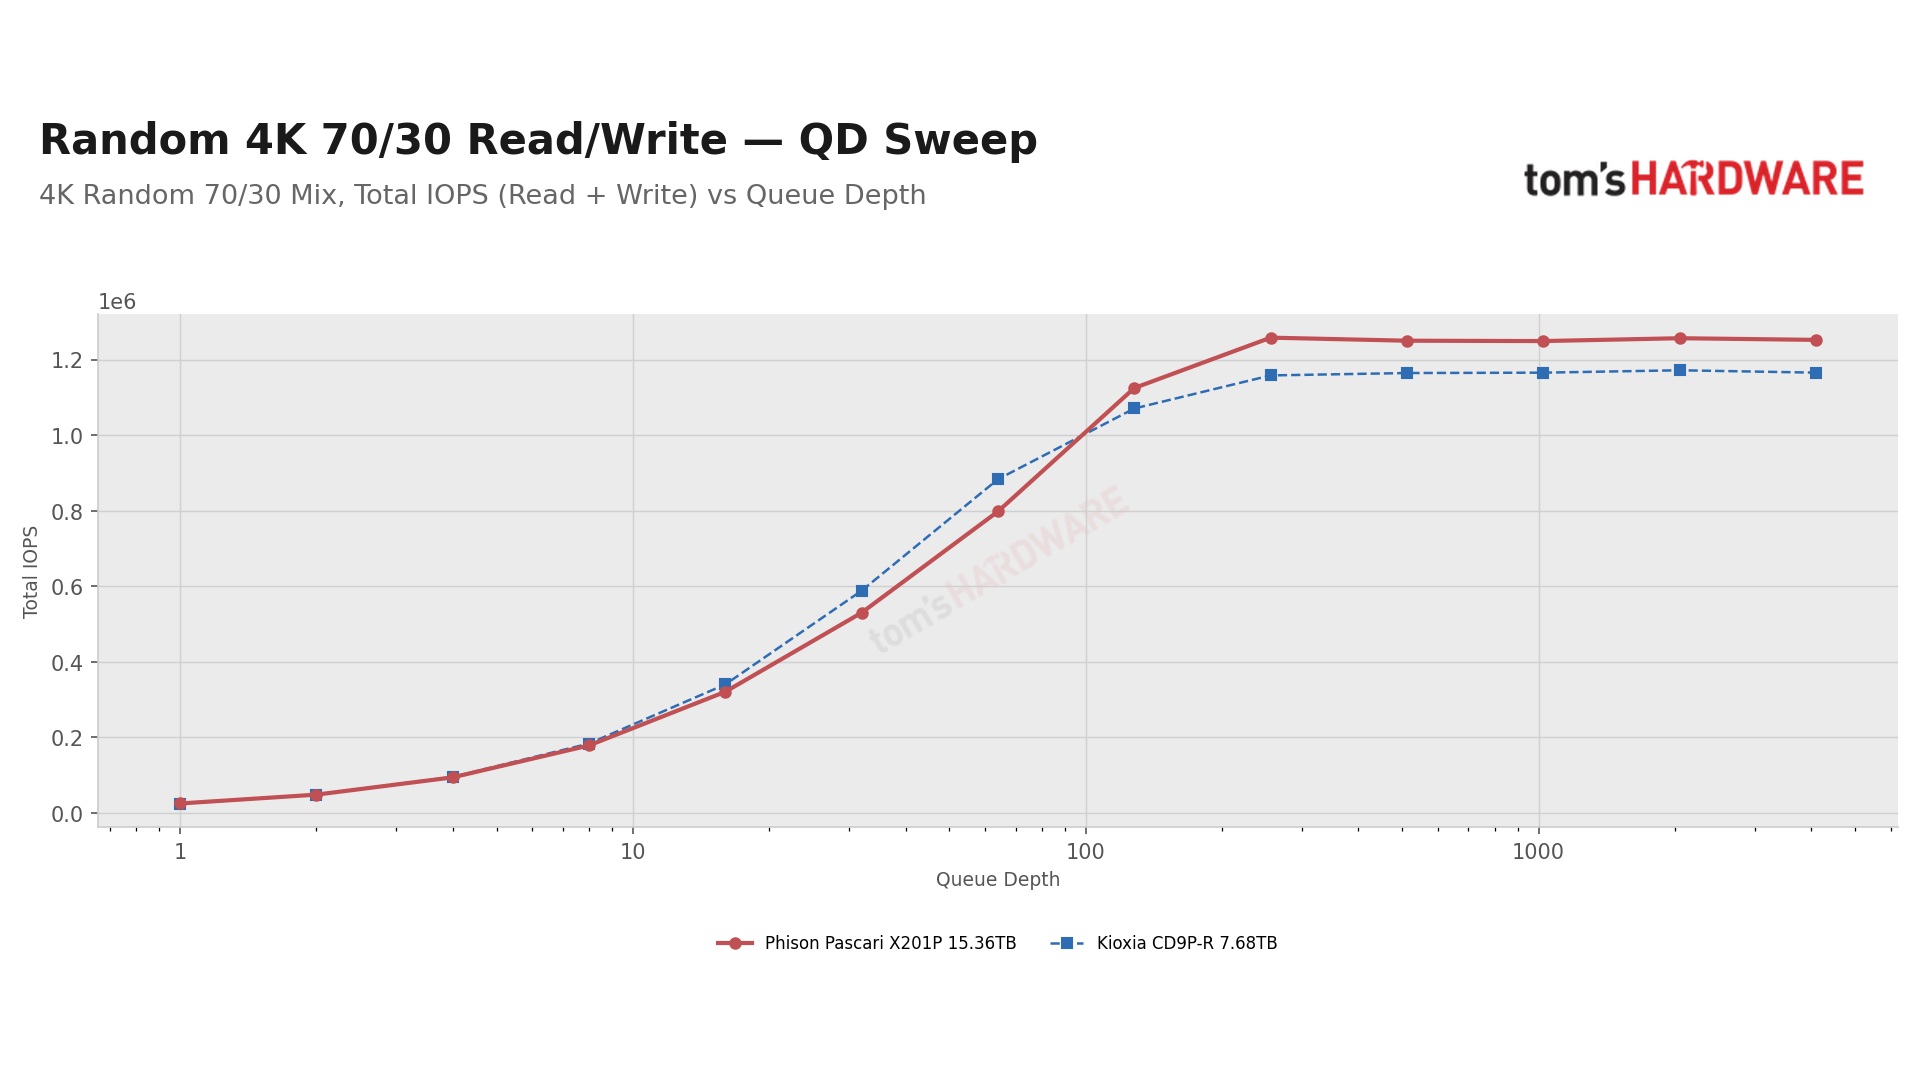
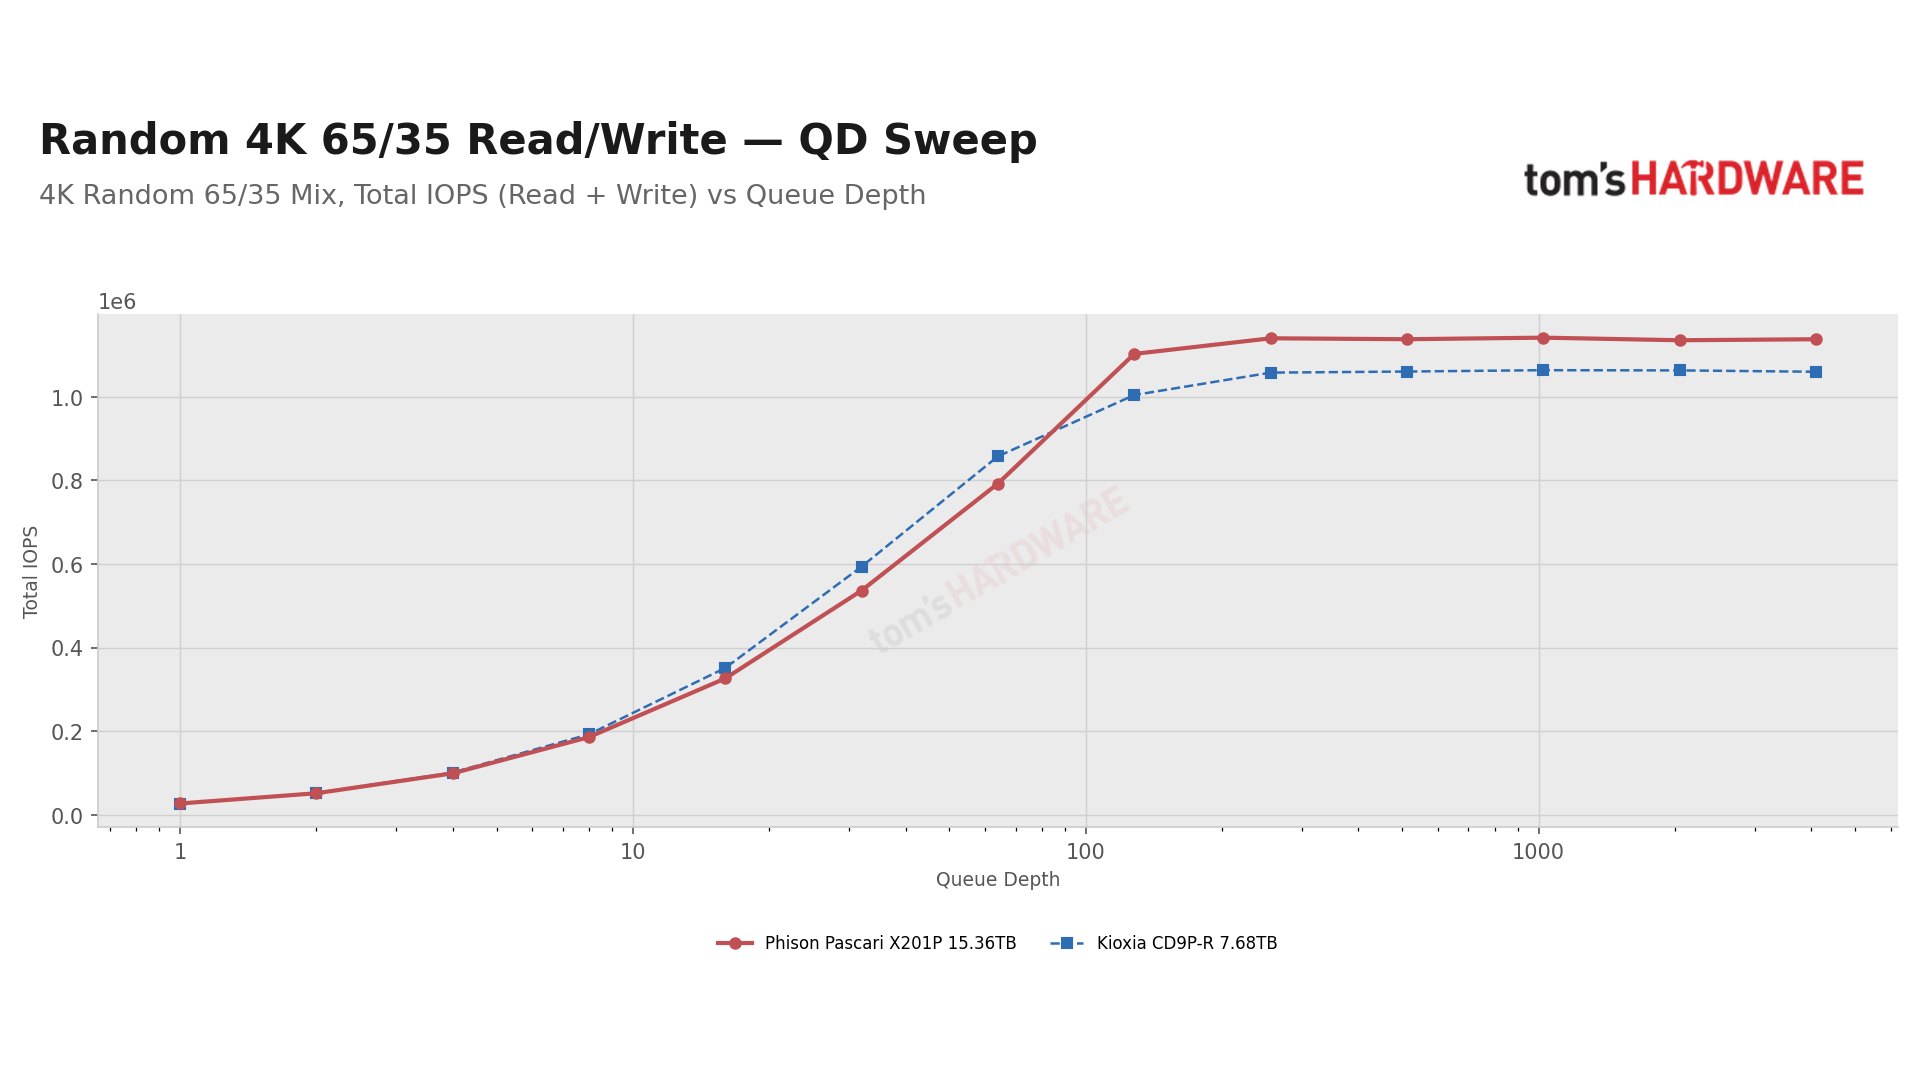
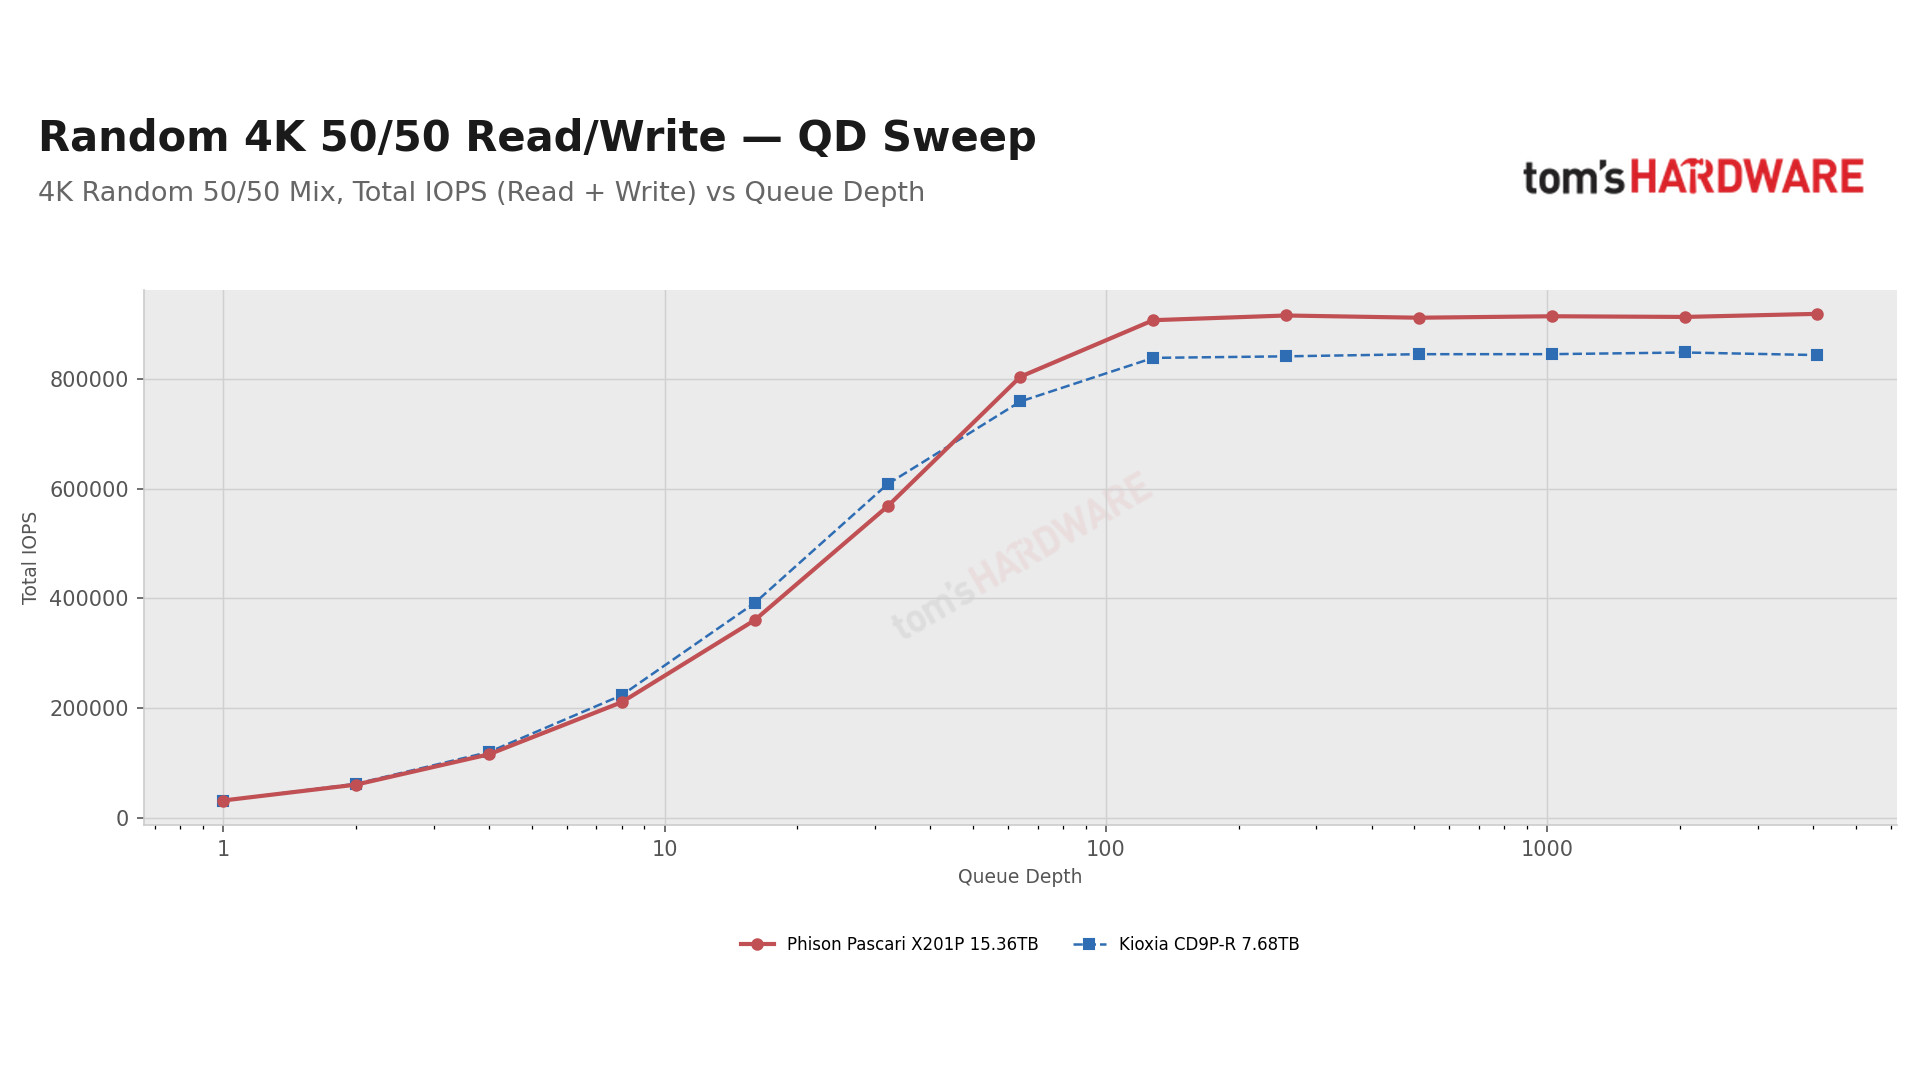
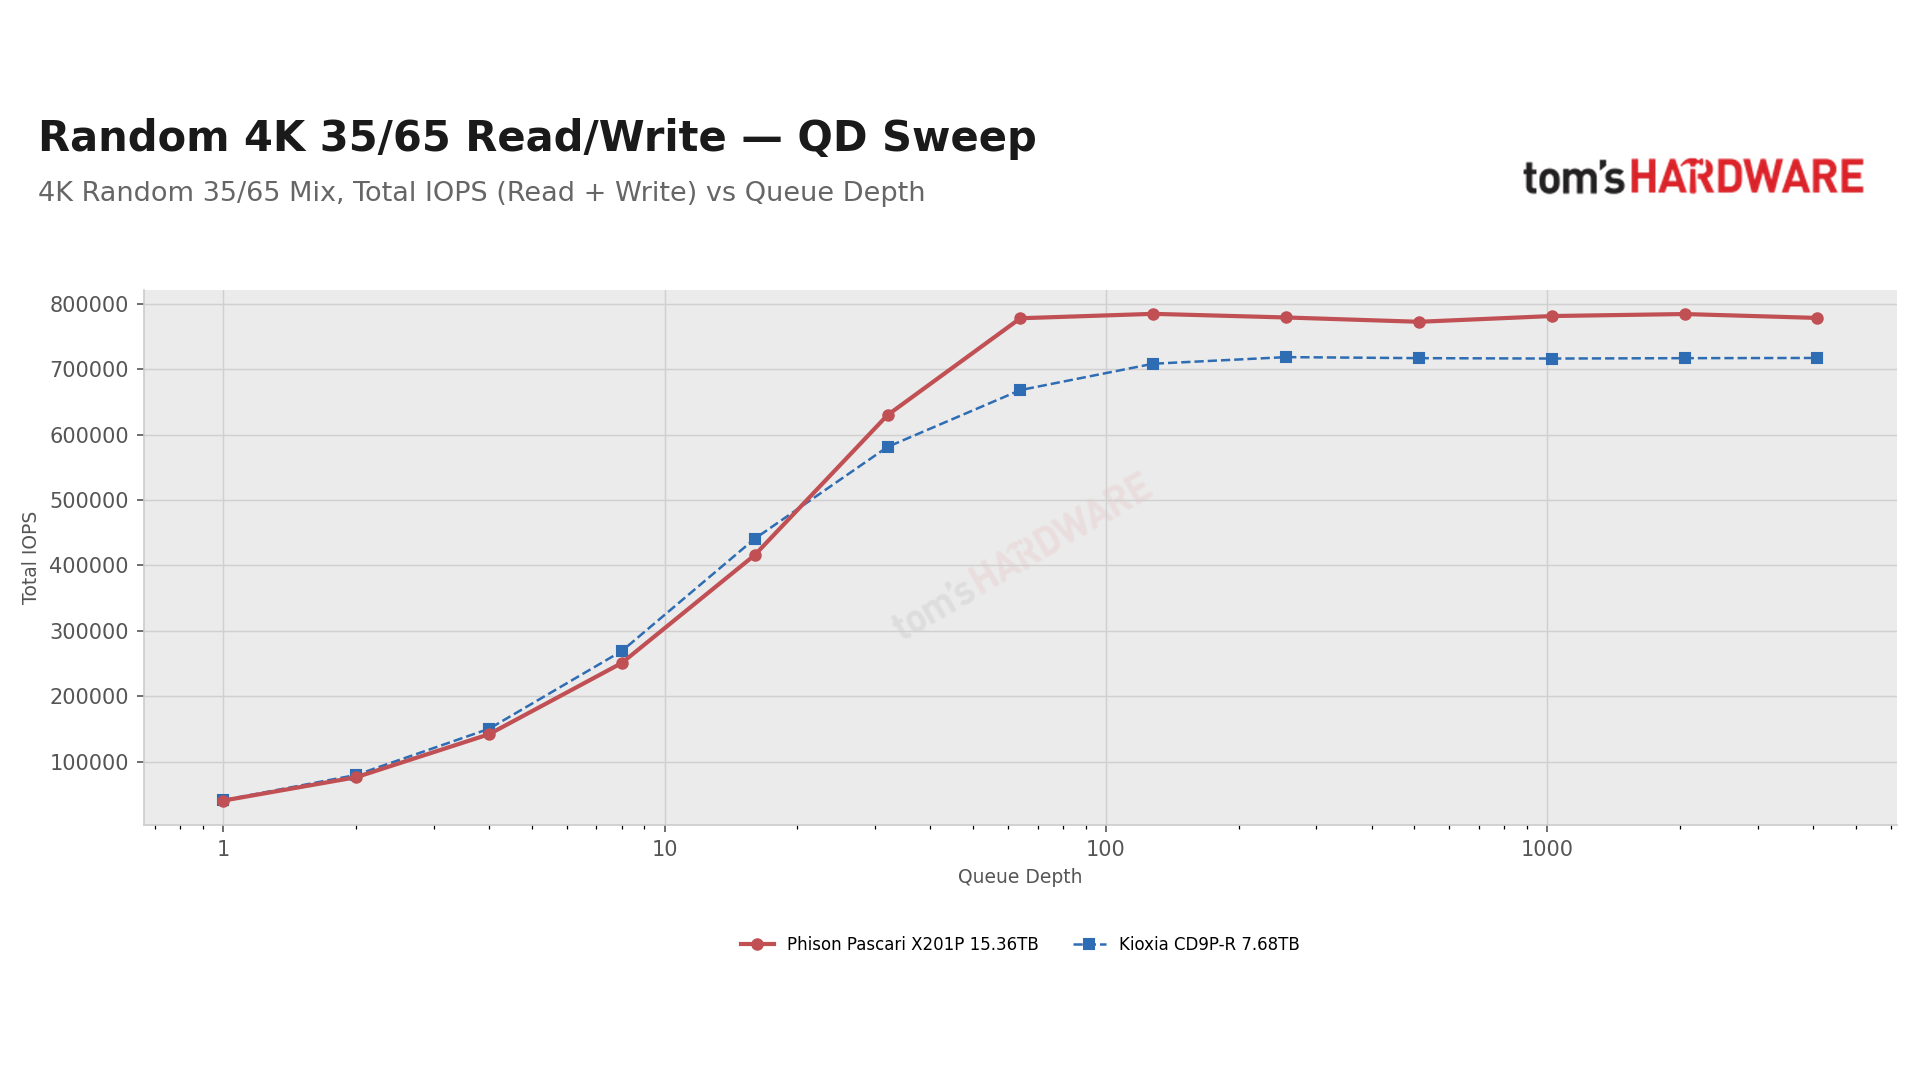
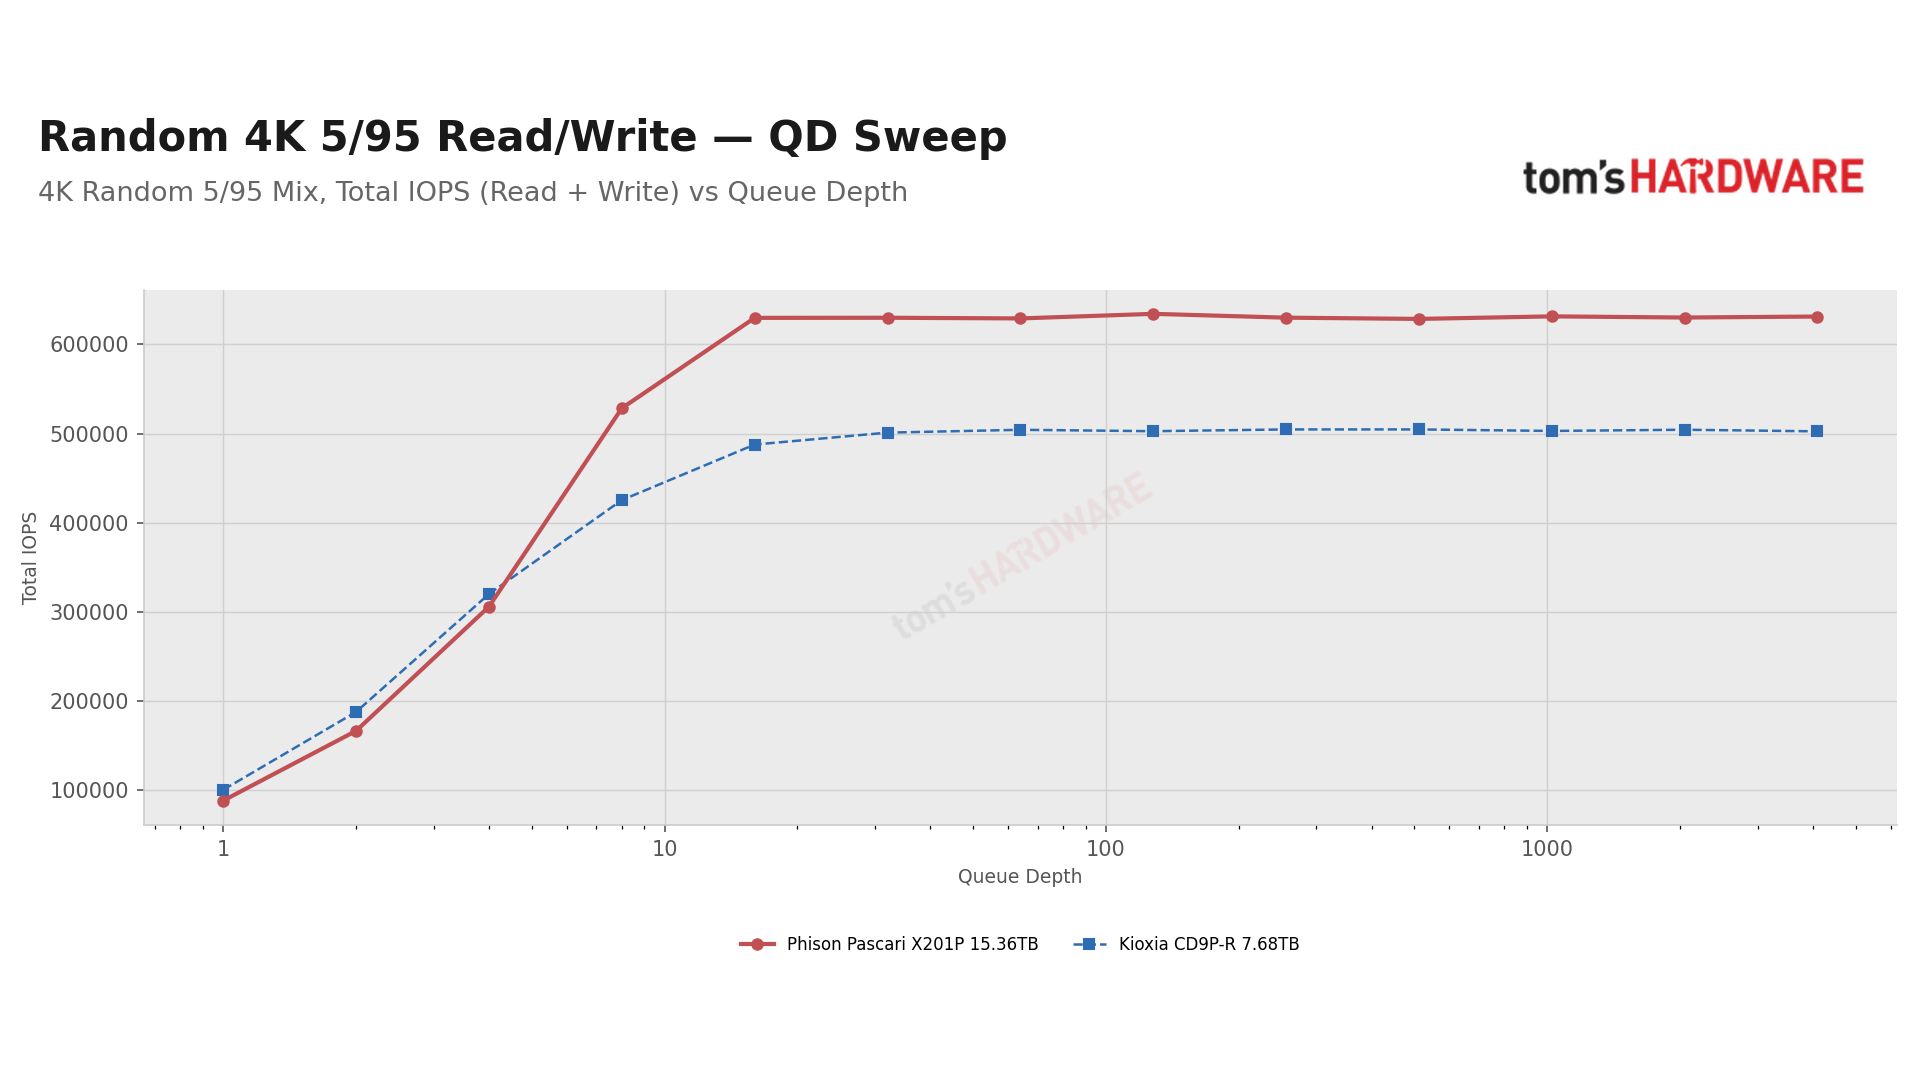
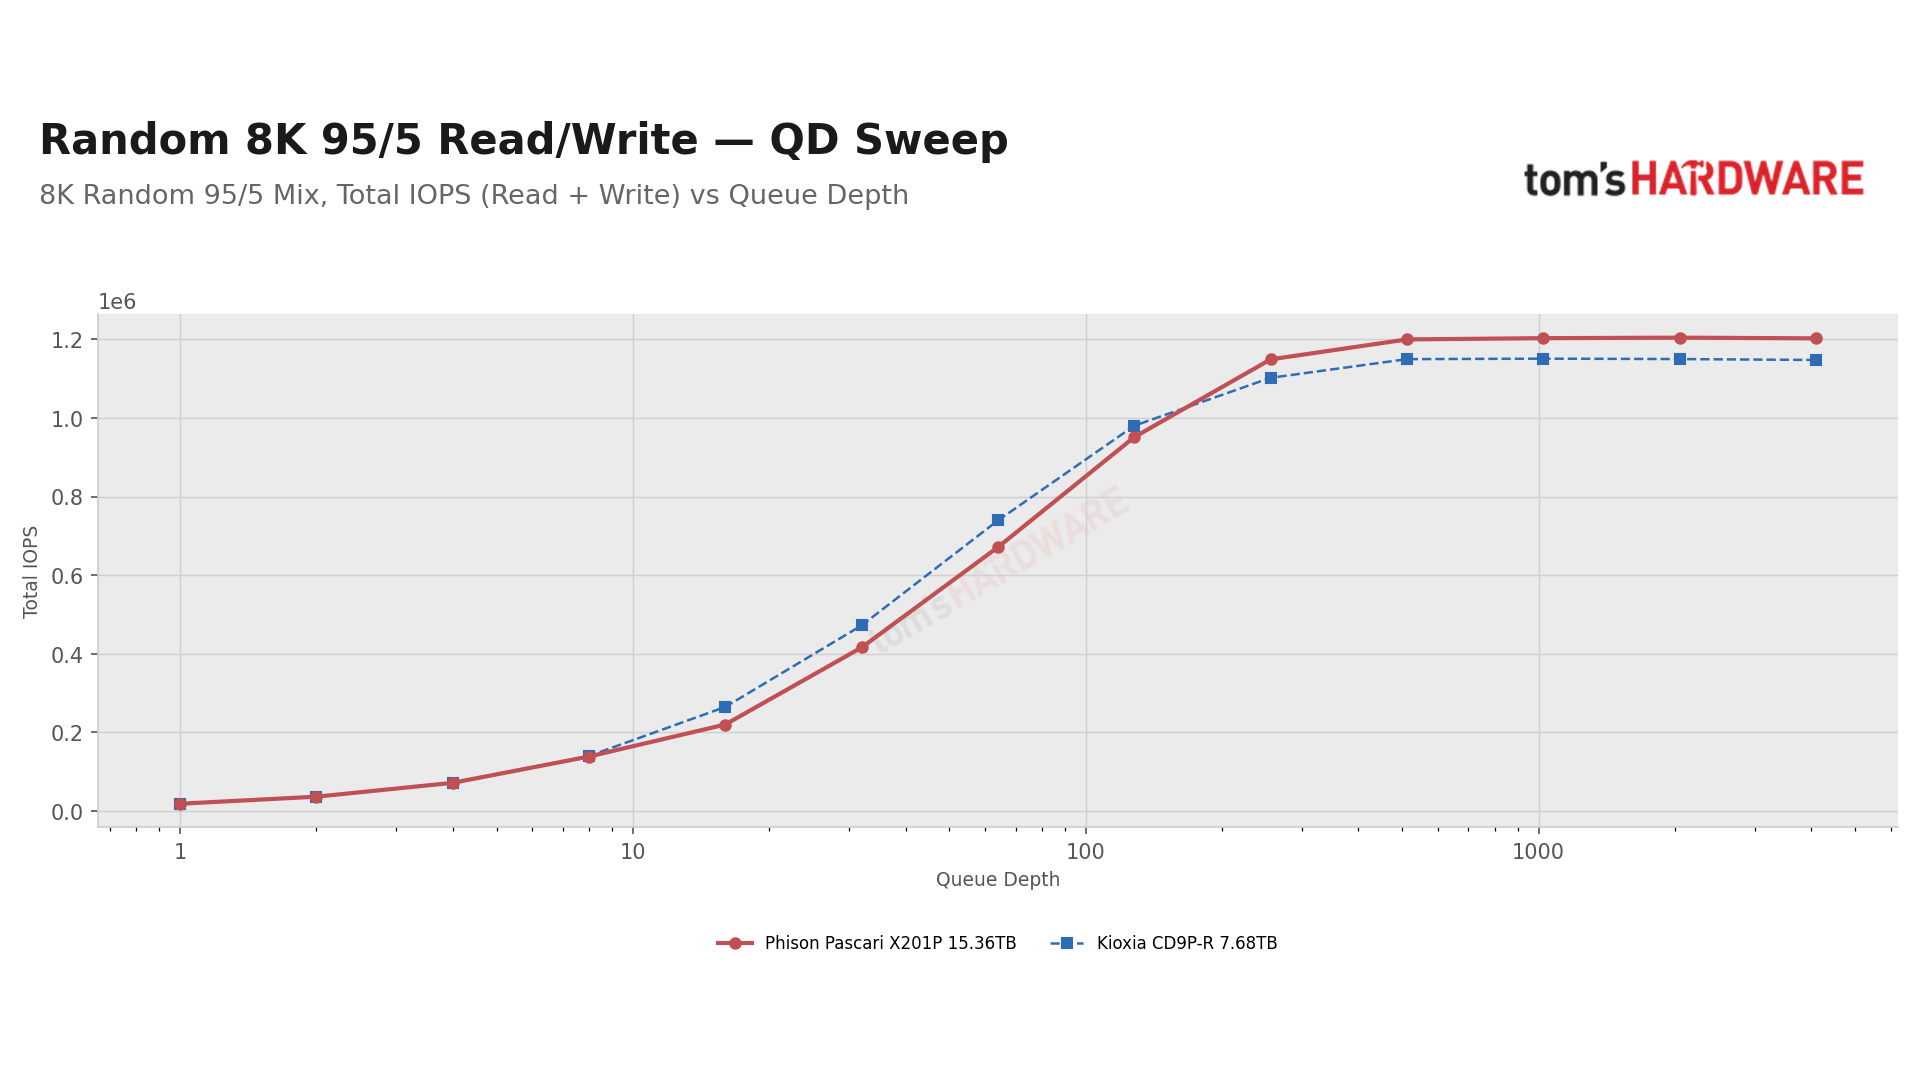
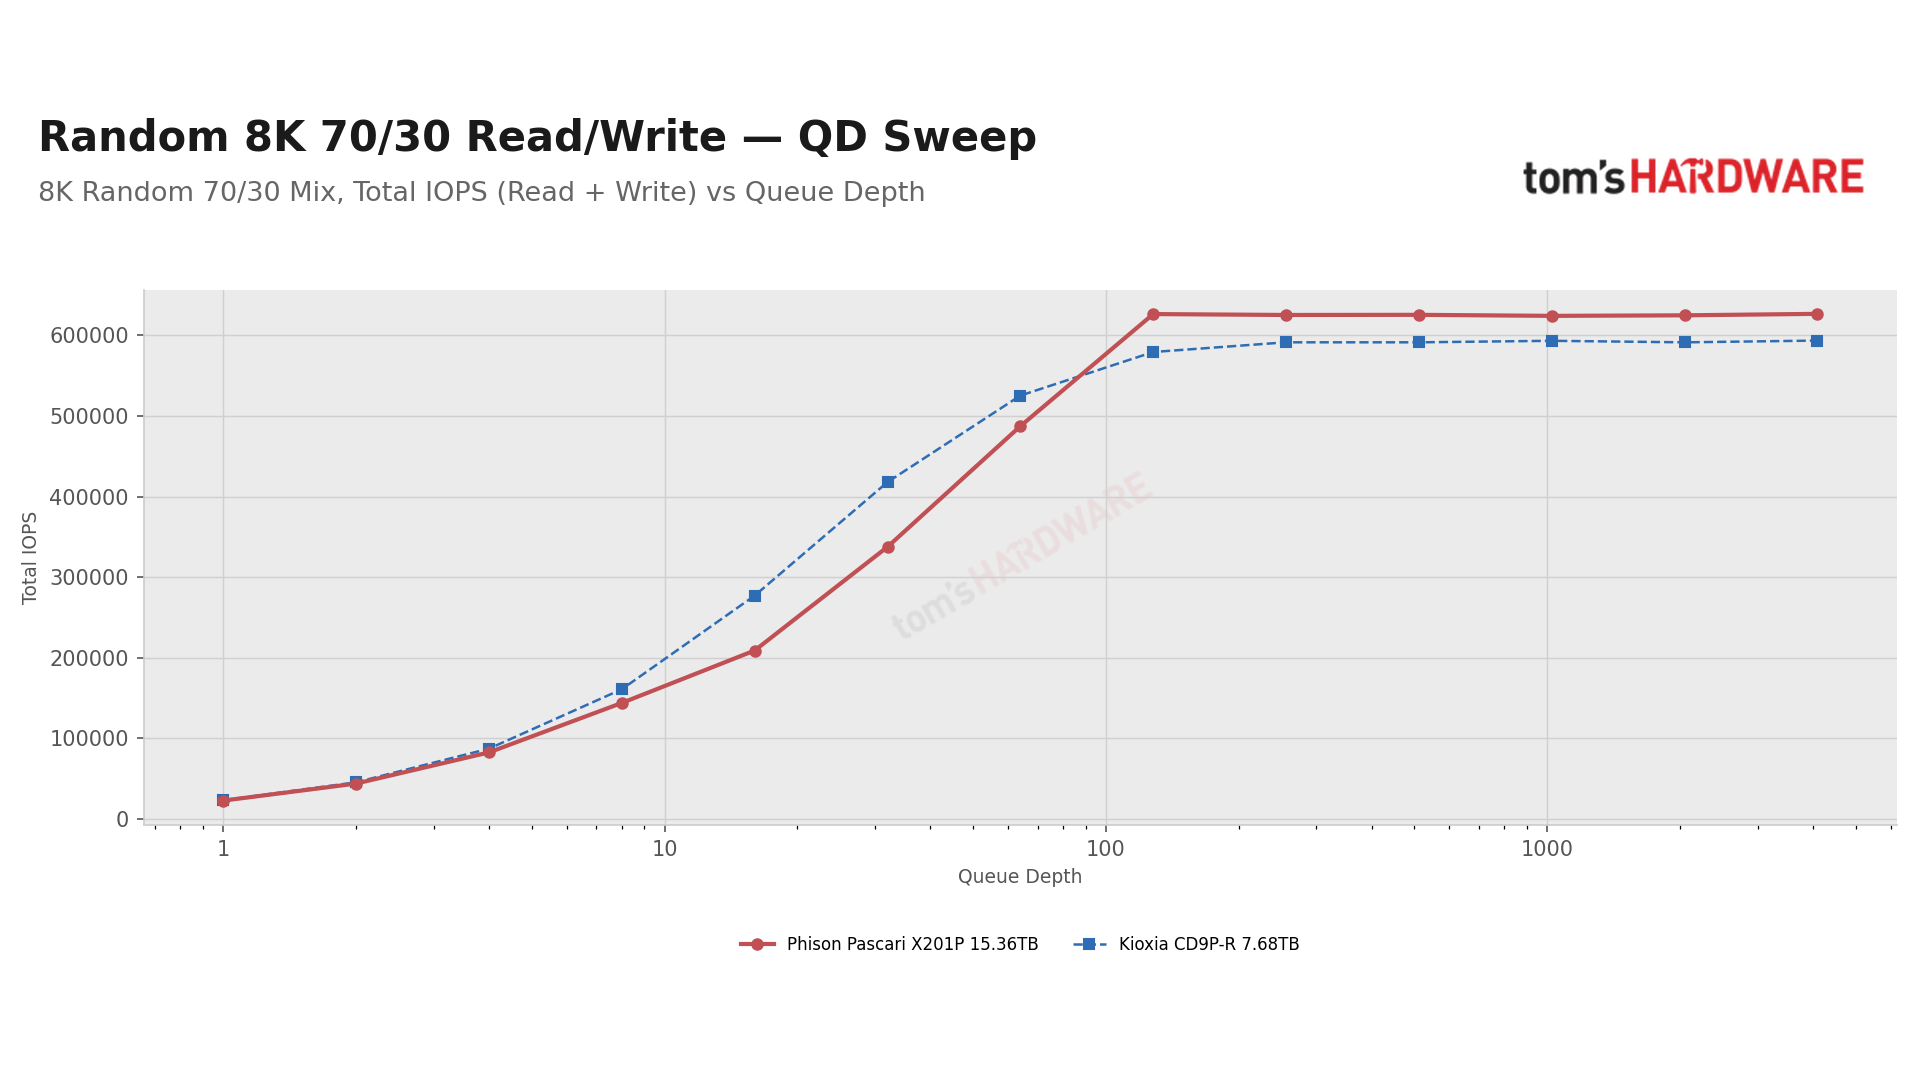
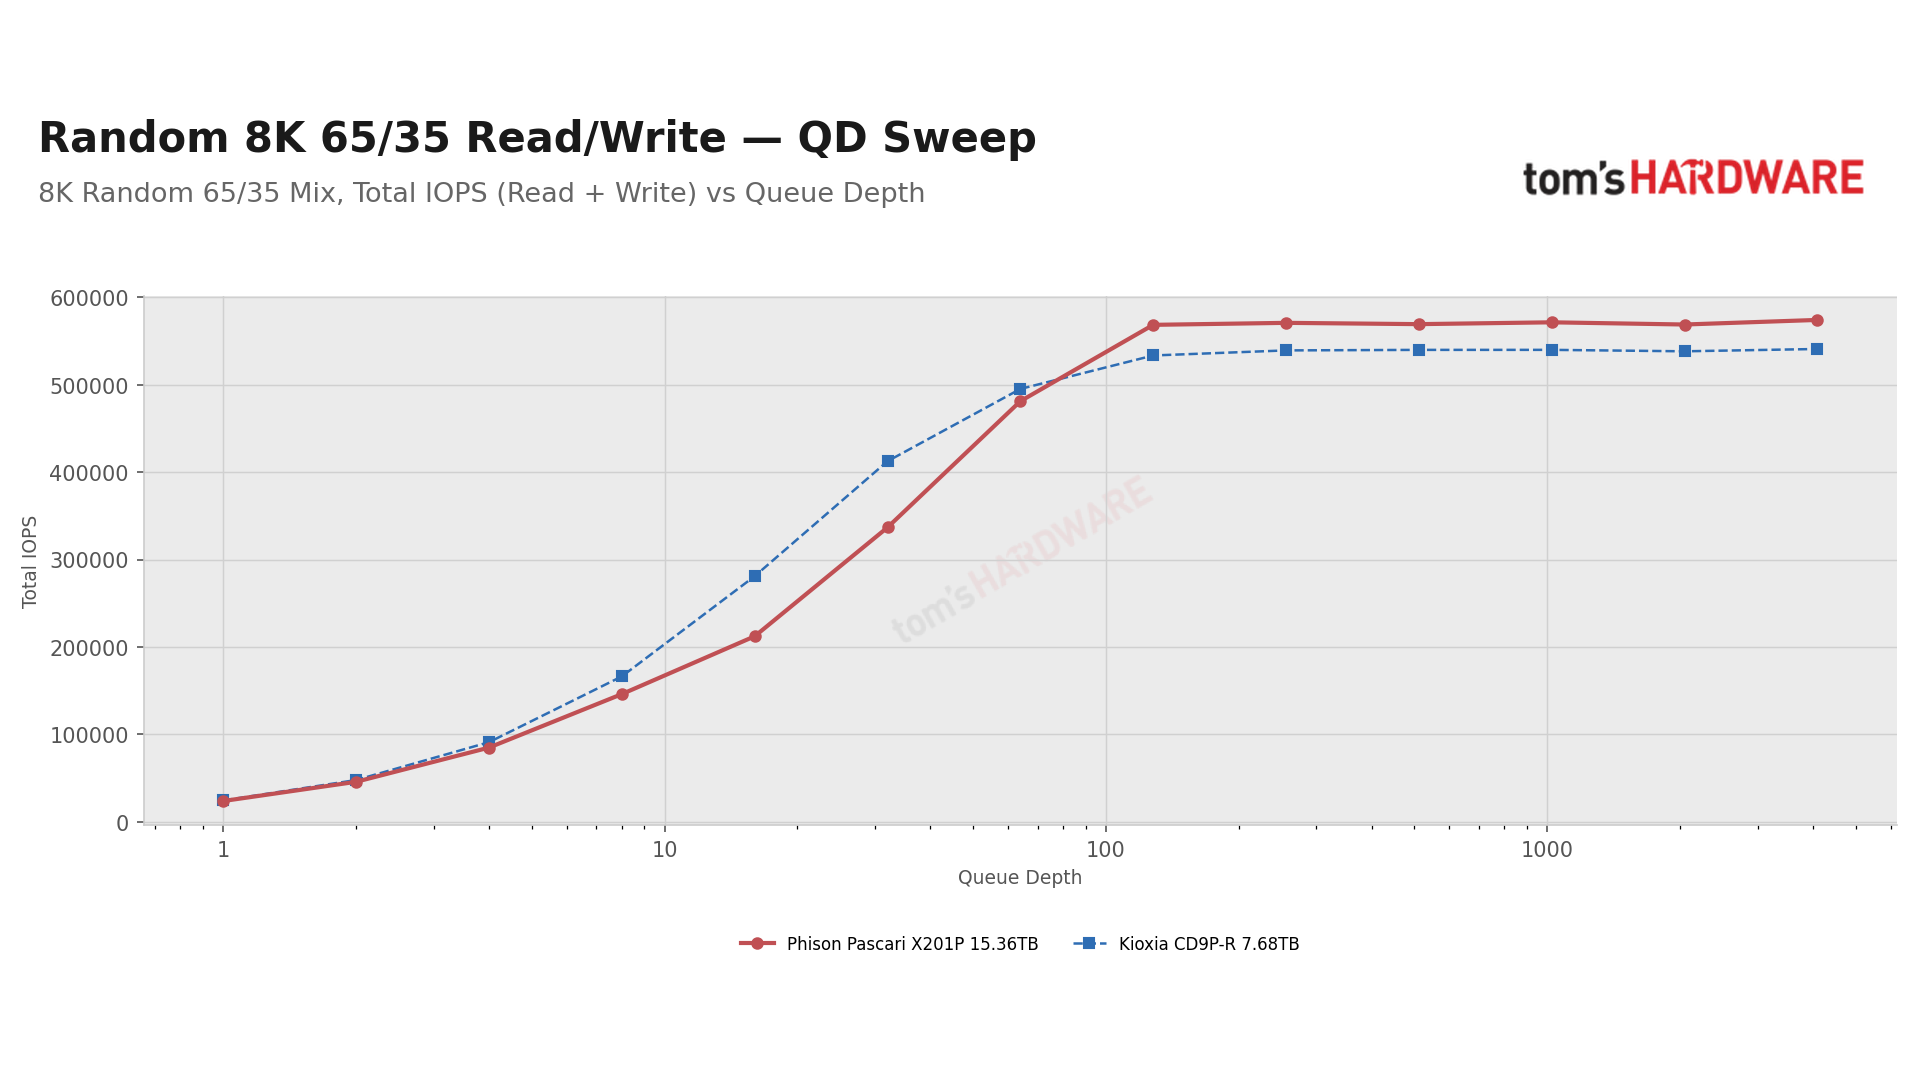
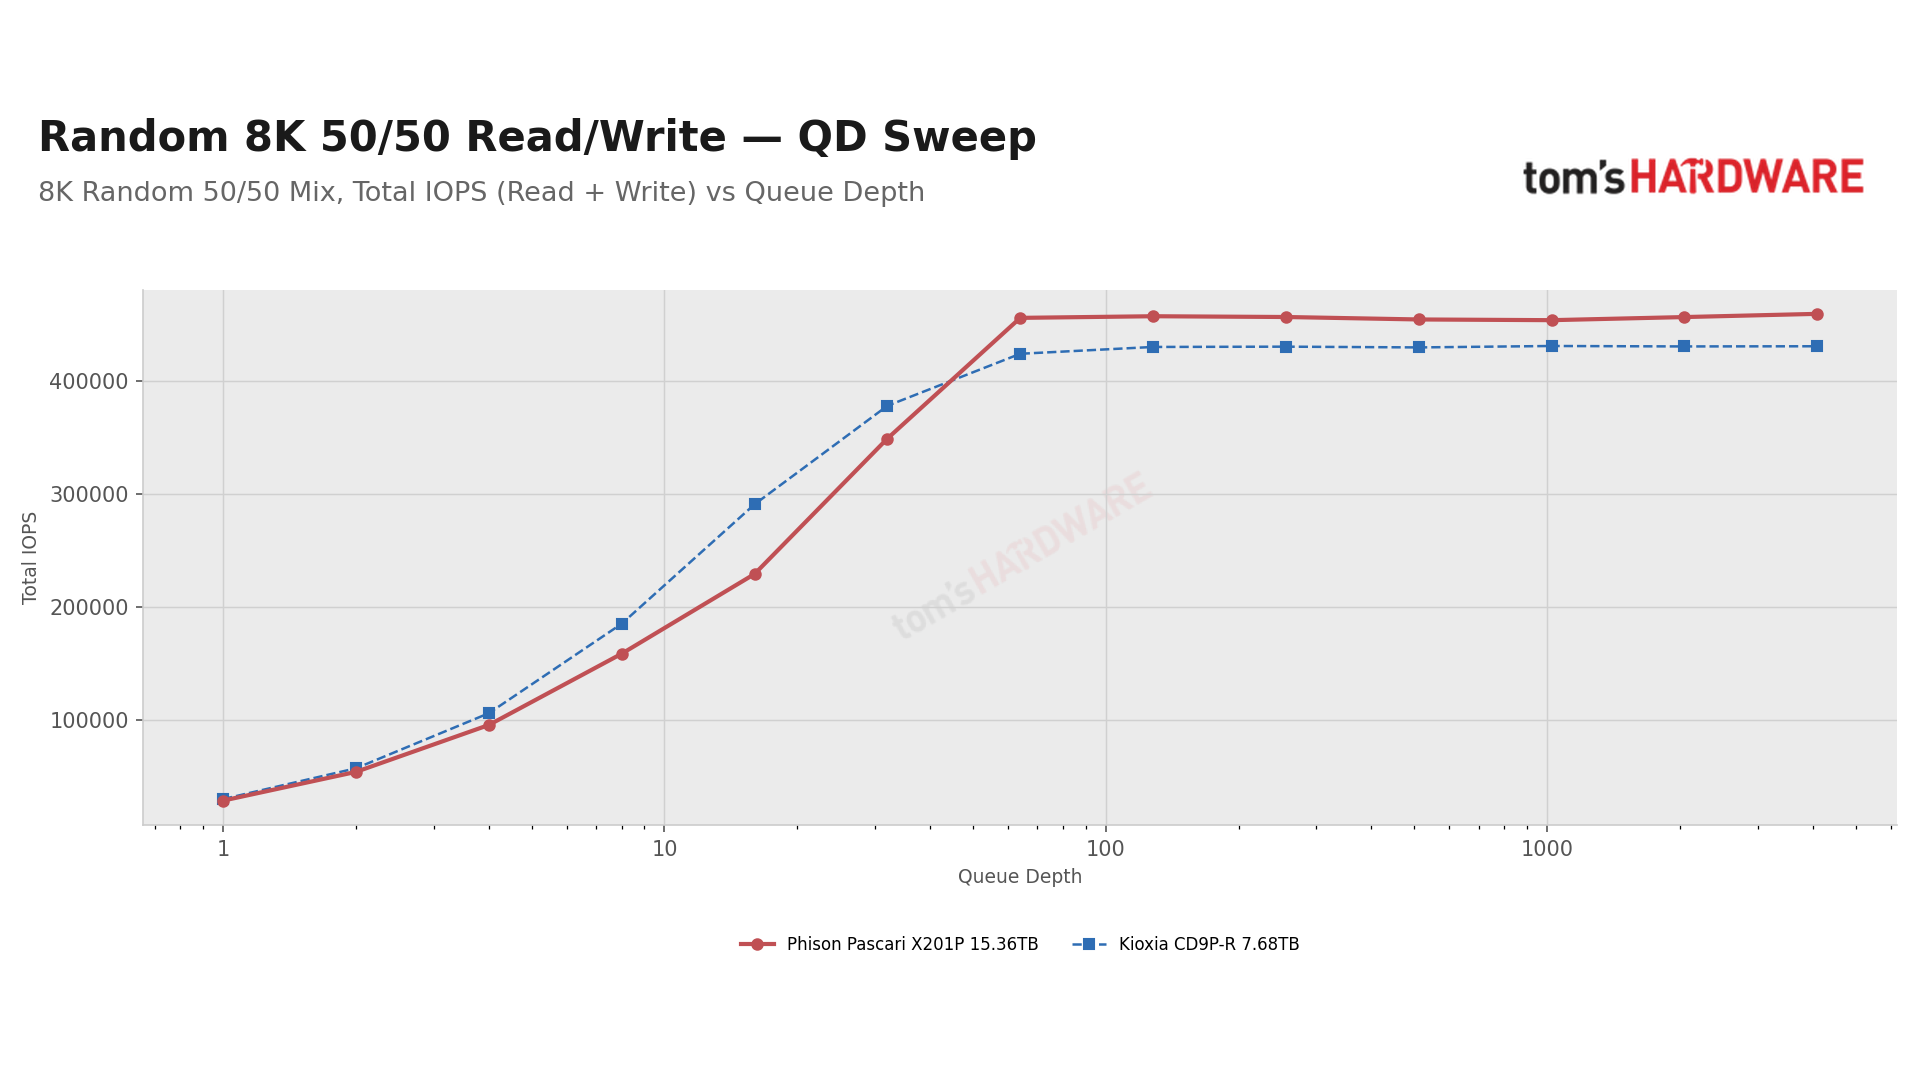
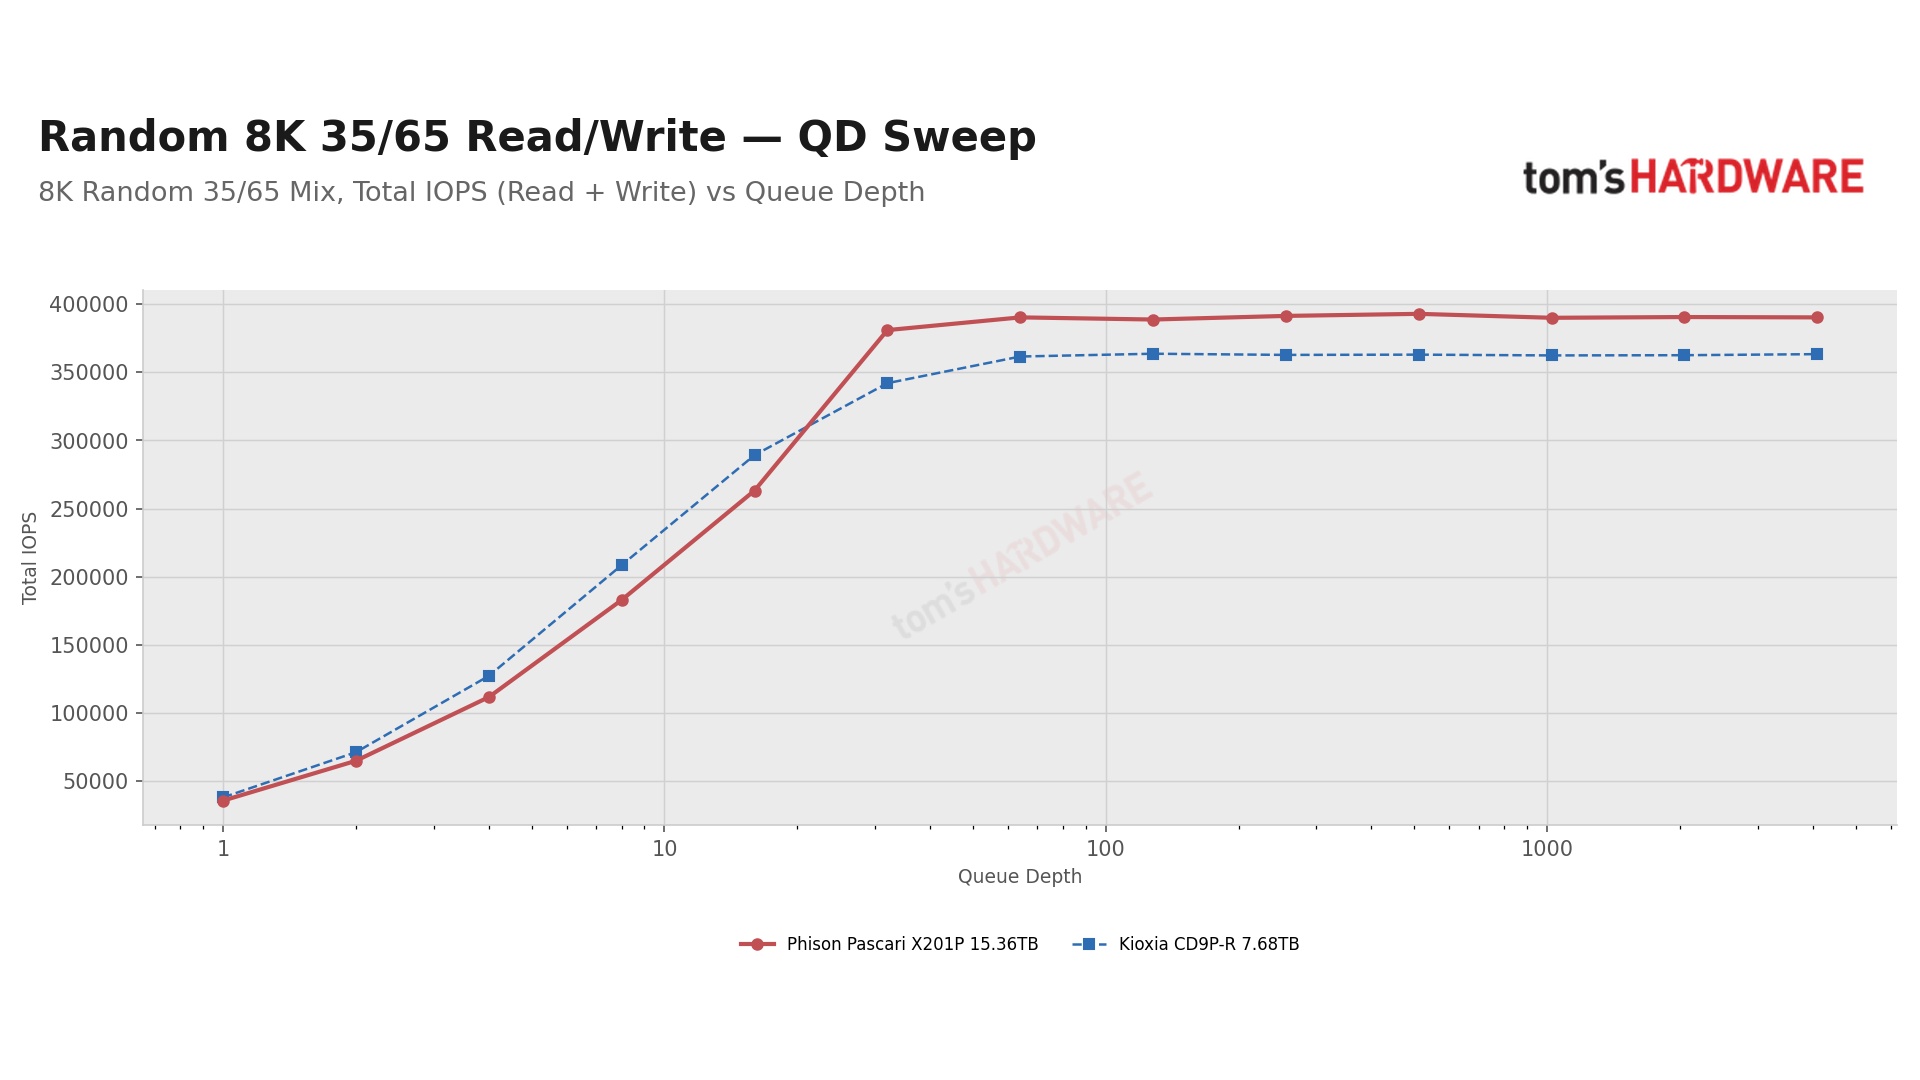
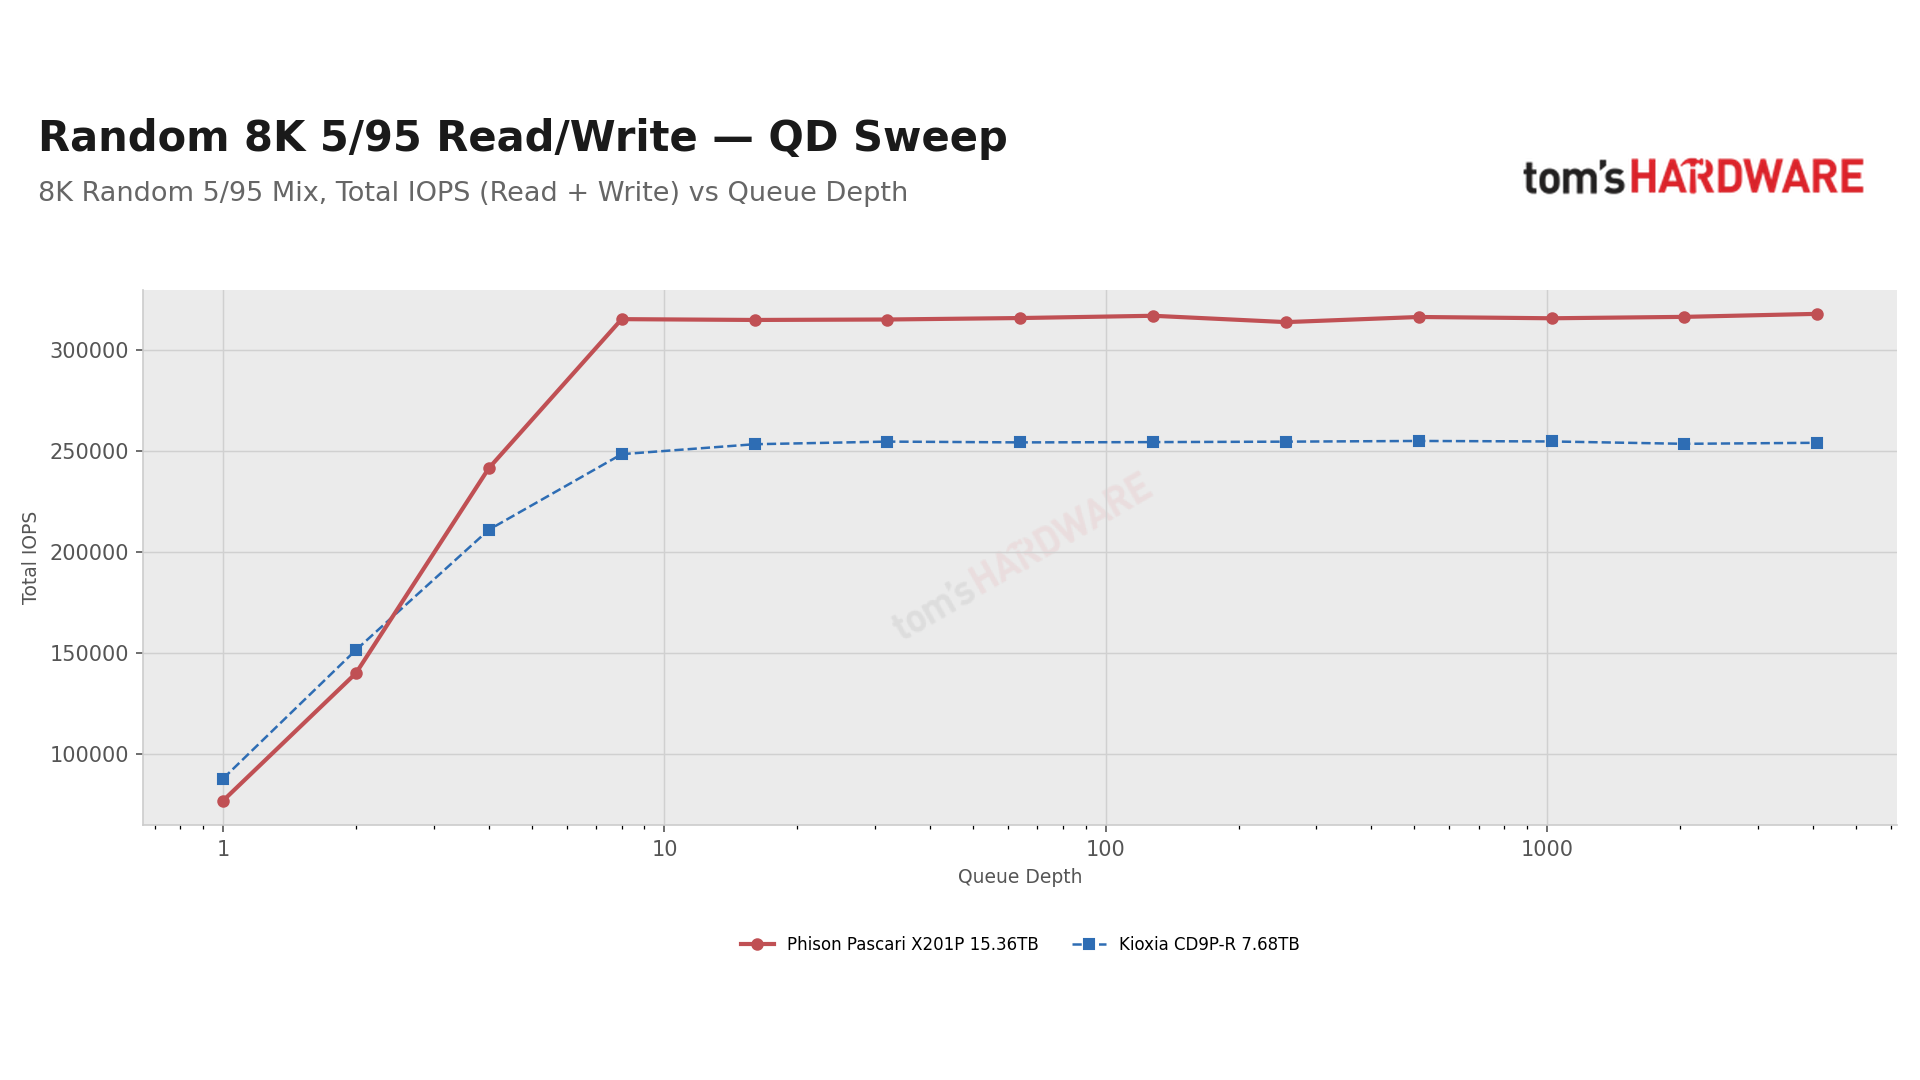
Phison emphasizes this test, and it’s a good one to test its claims. We can split the results into two halves. For the first: once a mix saturates, the X201P wins by 4 to 9% in most cases and by about 25% when the load is nearly all writes. Its 4K 70/30 results match Phison’s claims, passing one million IOPS at QD128 and leveling off at 1.25 million.
In the middle of the range, though, roughly QD4 through QD64, the half-capacity CD9P-R delivers more IOPS in most mixes, up to 11% at 4K and 33% at 8K. Part of that 8K gap is the X201P’s 8K read soft spot rather than the mix itself. However, the more writes that are in the mix, the sooner the X201P takes over.
Things are not all bad for the X201P in the middle, as it has tighter read latency: in the 4K 70/30 mix, its slowest read in 10,000 (P99.99) takes about half as long as the CD9P-R’s from QD1 to QD32. Two of the three re-tested points are in these charts: the 4K 65/35 mix at QD256 and the 4K 5/95 mix at QD16.
Latency and QoS — Tail Latency
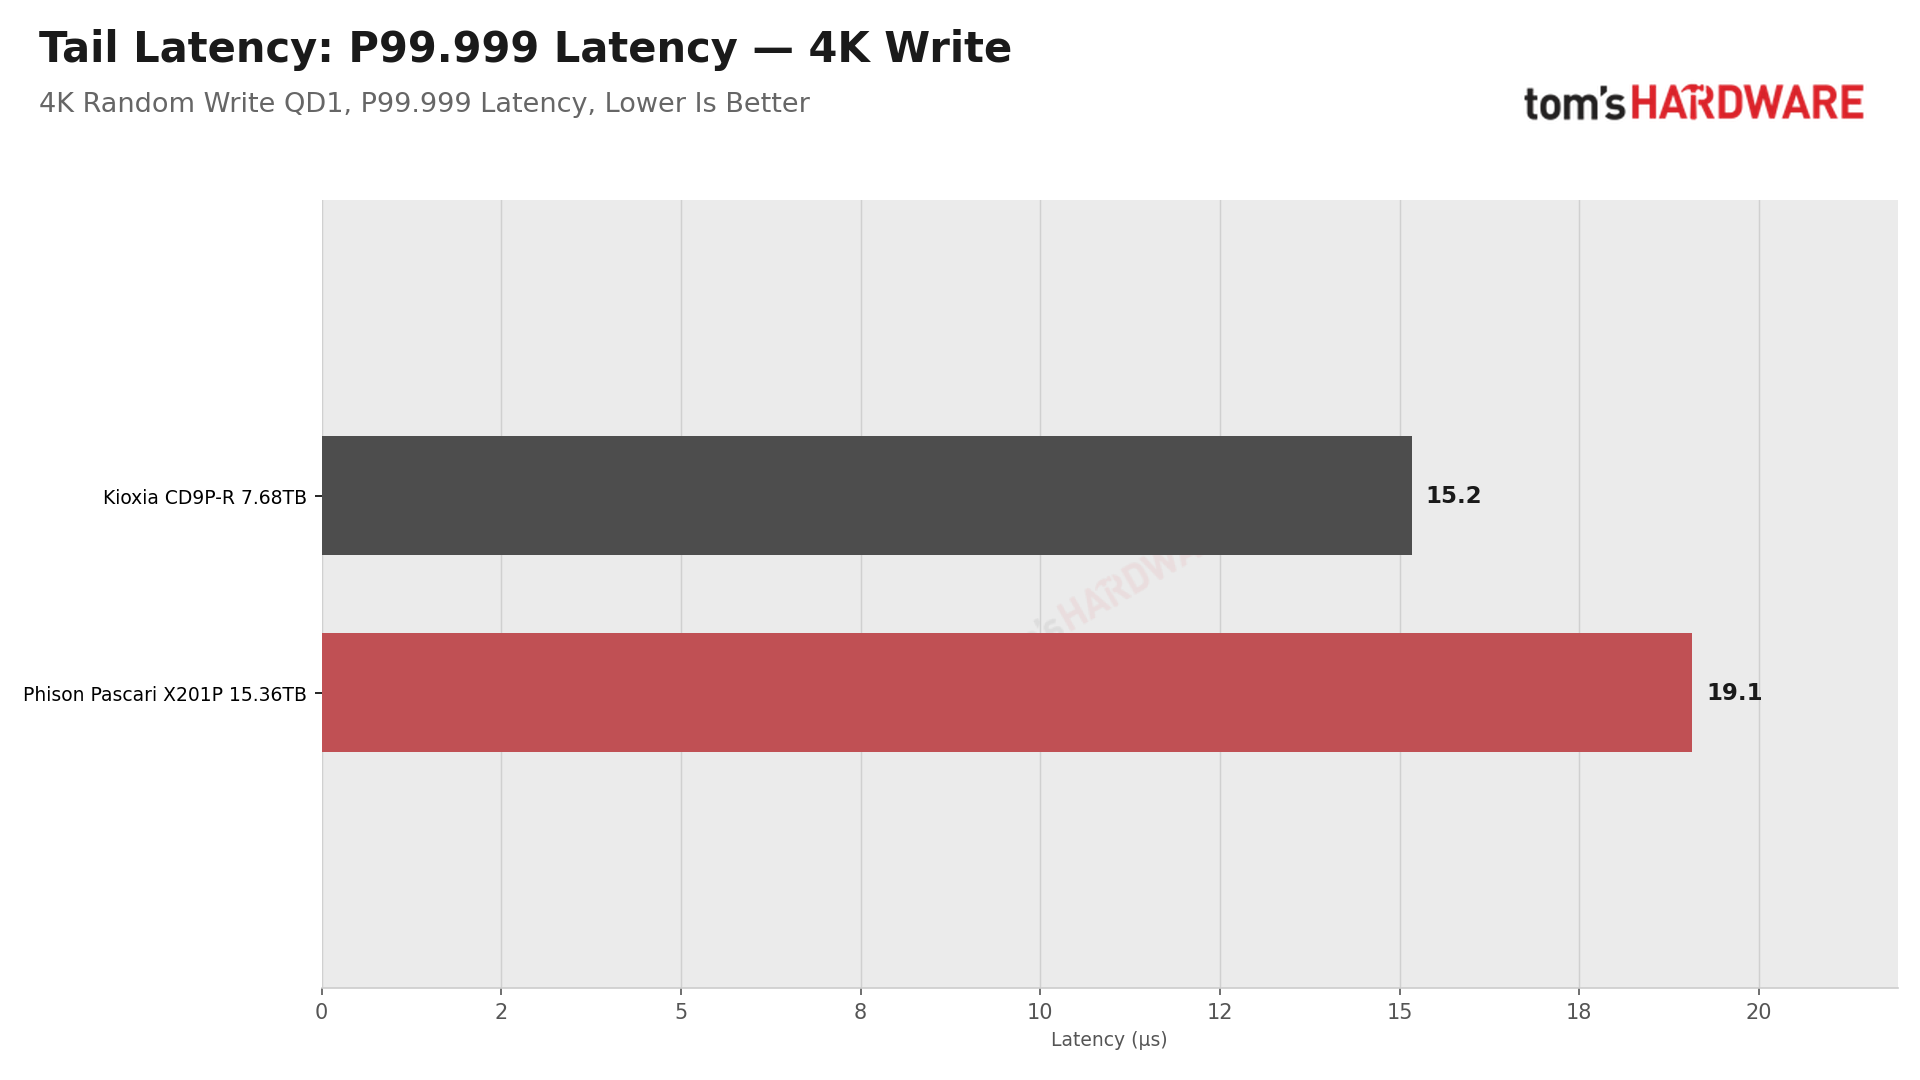
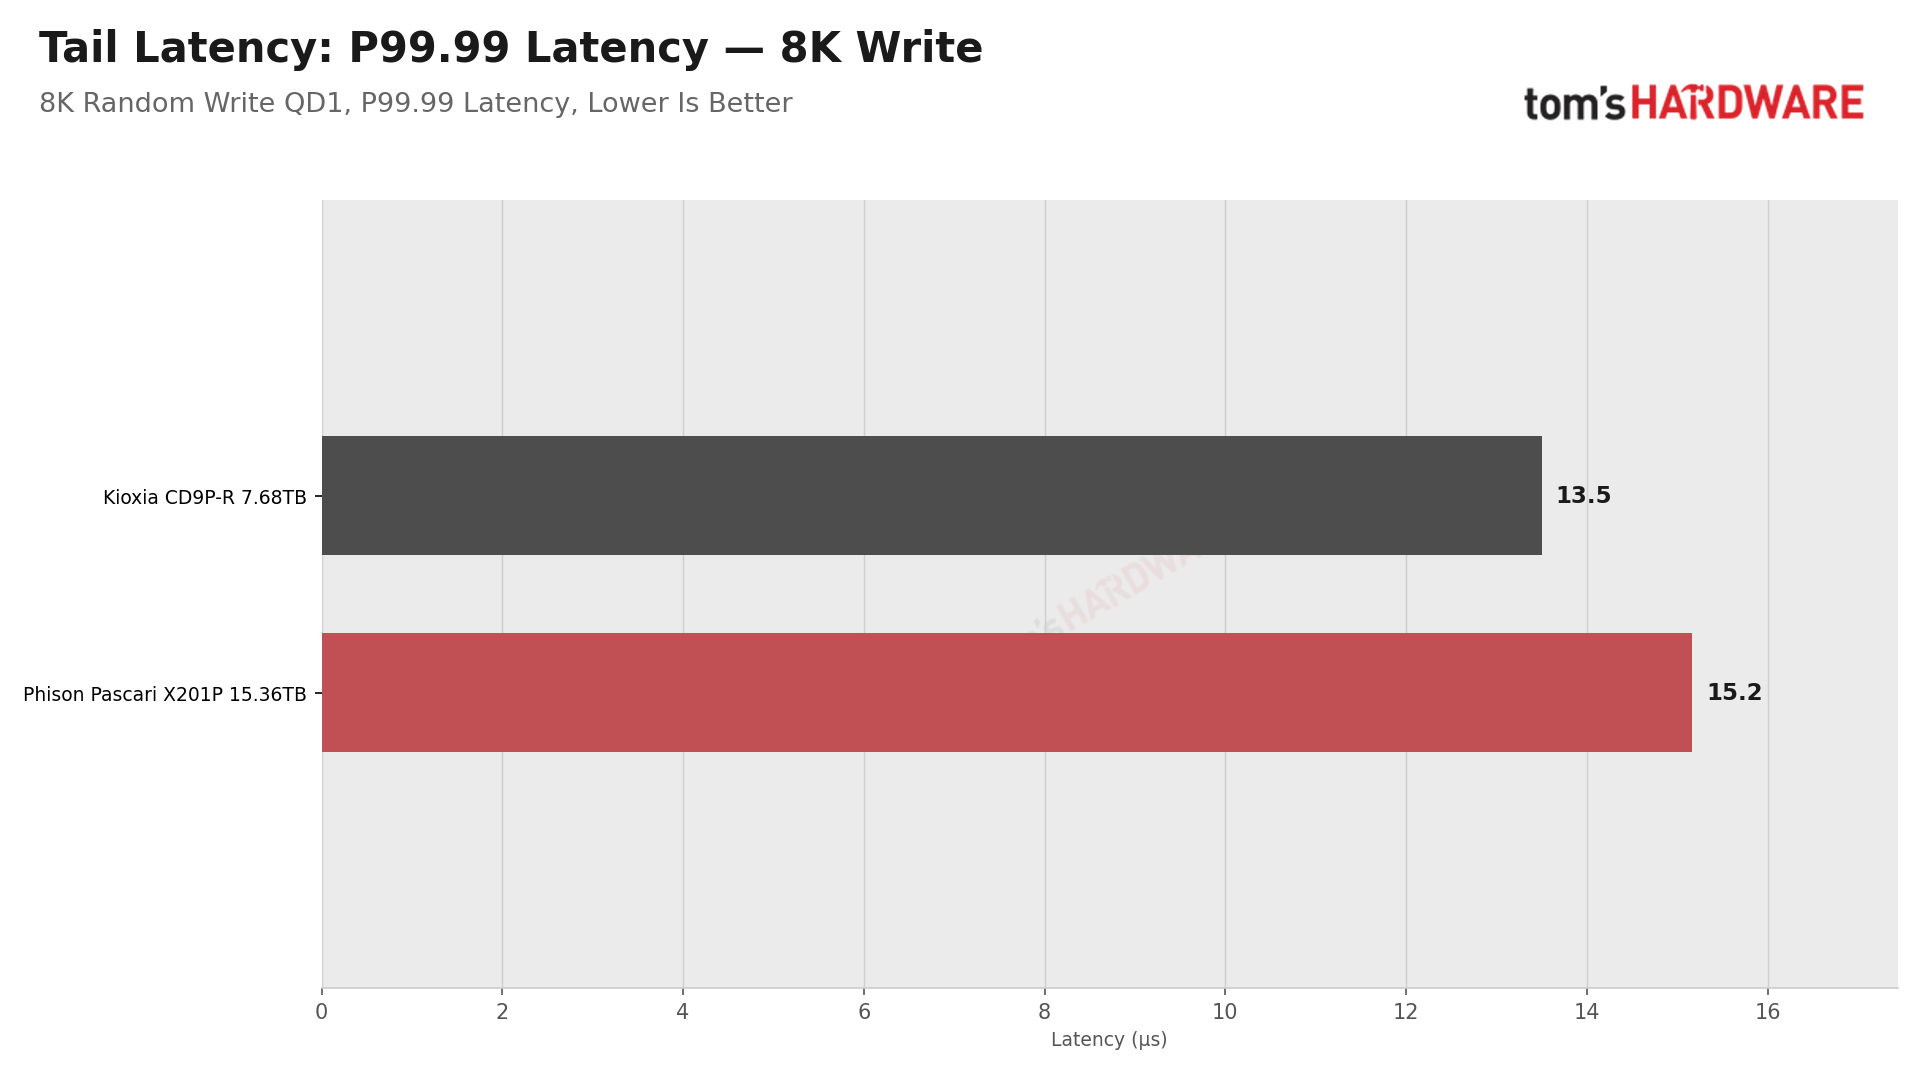
Average latency hides the slow requests that users actually notice, and at enterprise scale those outliers can add up quickly. At a million IOPS, the slowest 0.001% of requests, the 99.999th percentile (P99.999), still amounts to ten every second. We measure 4K and 8K random reads and writes at QD1, QD4, and QD16, and report latency from the median (P50) through P99, P99.9, P99.99, and P99.999. Each point runs for two minutes. A tight spread between the median and the deepest tail means predictable service; a wide one means occasional stalls.
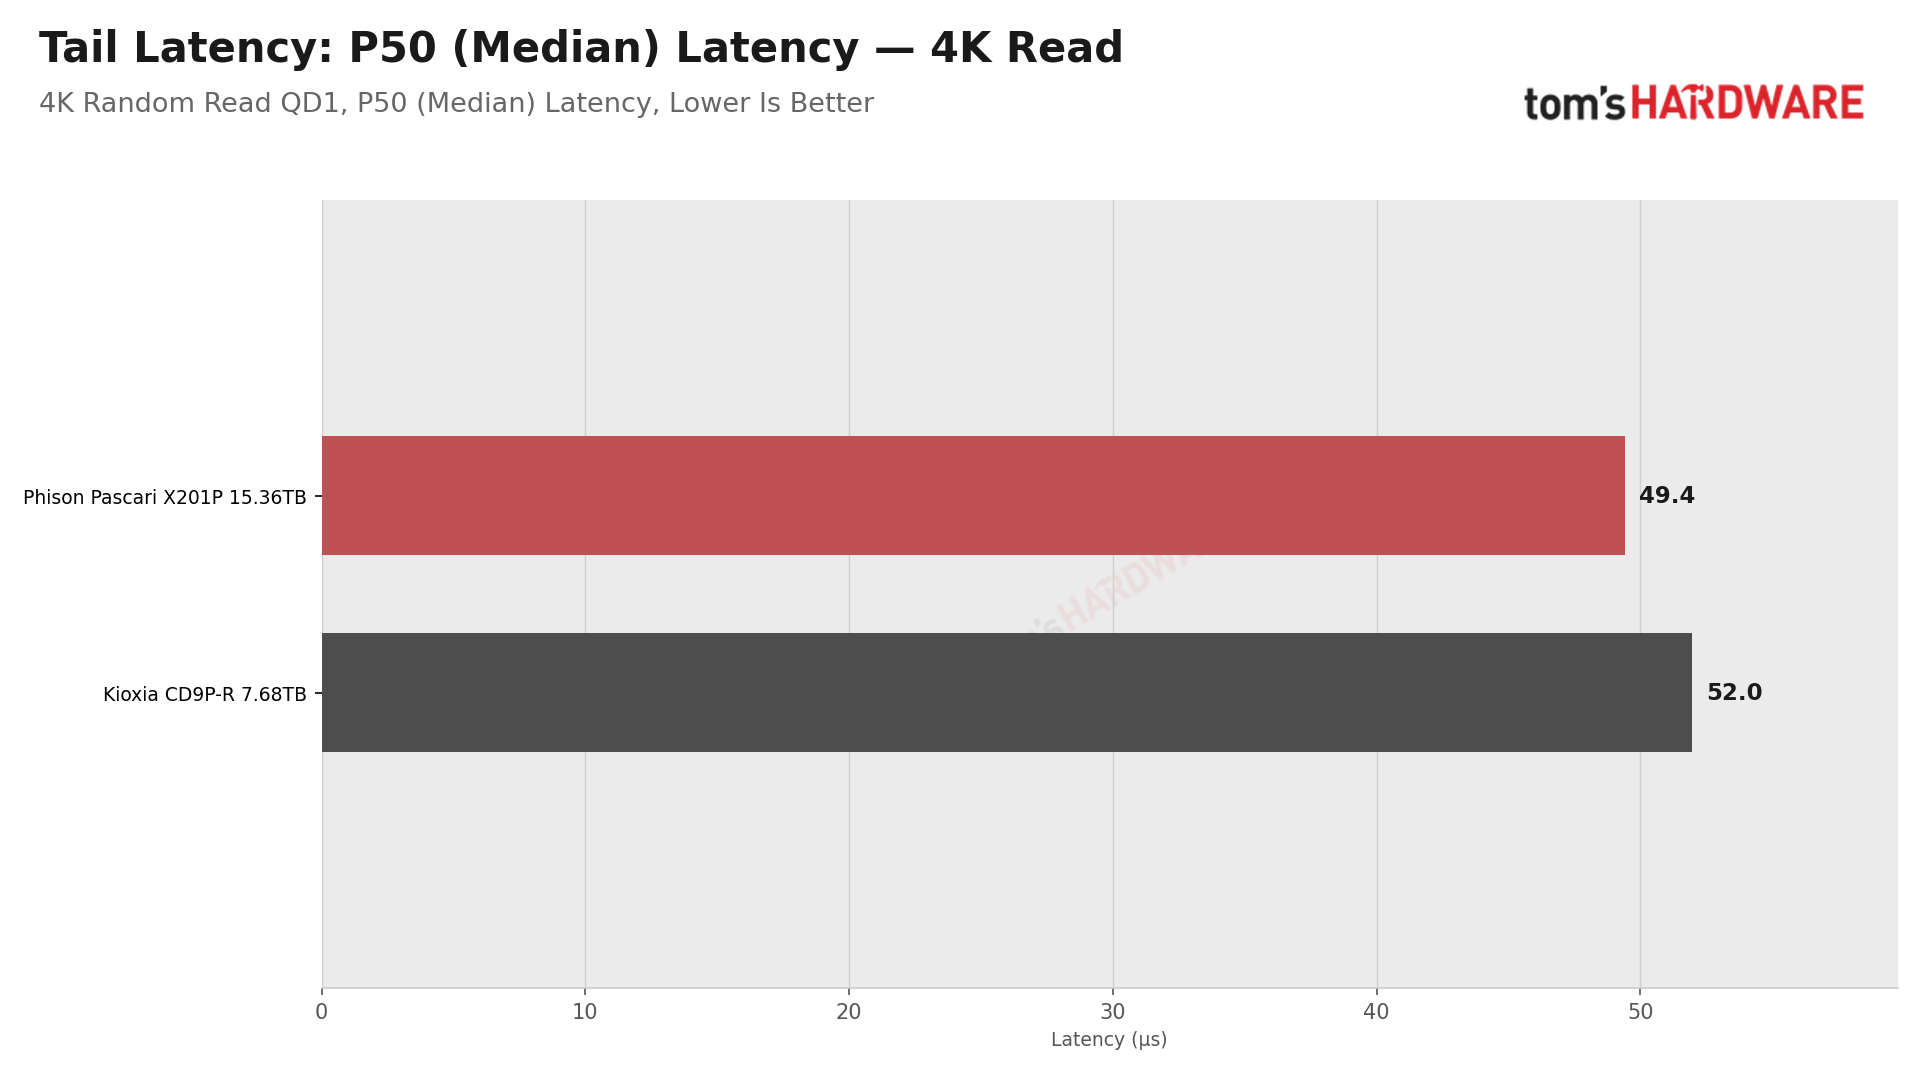
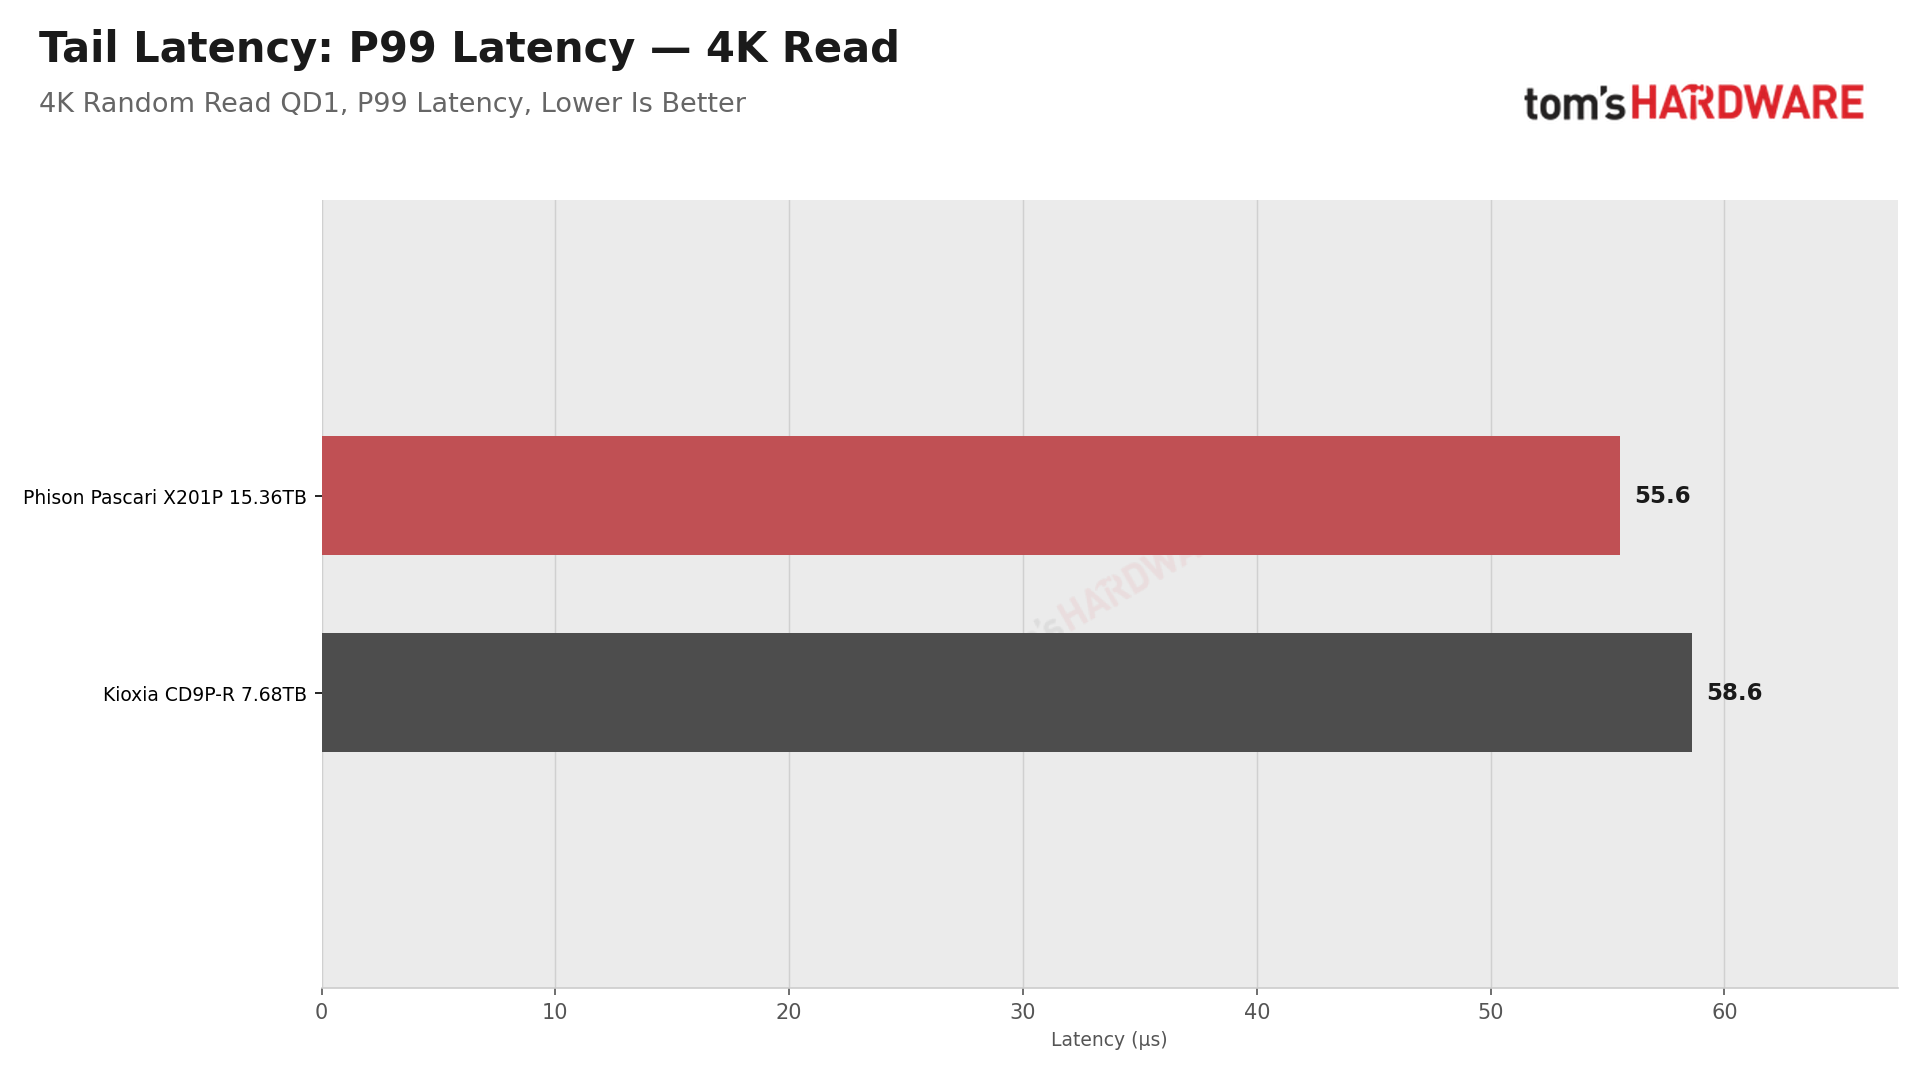
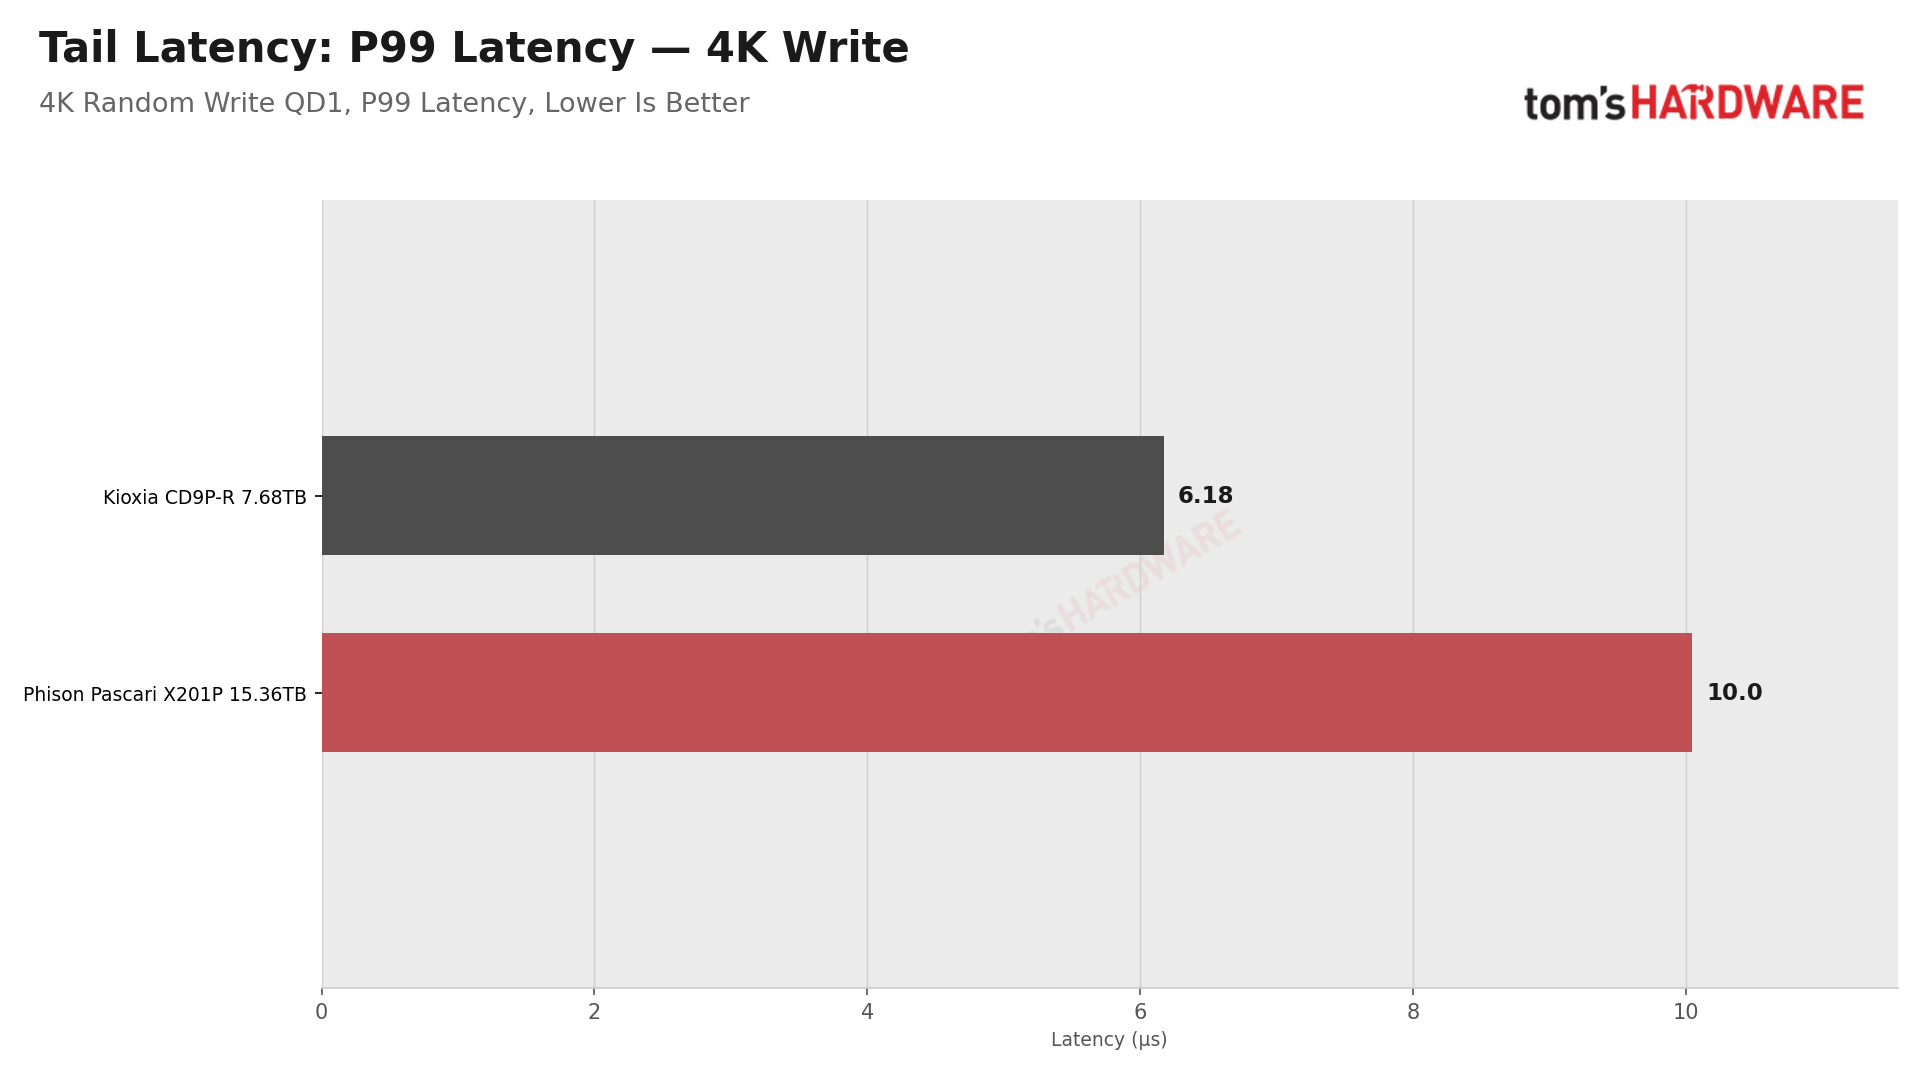
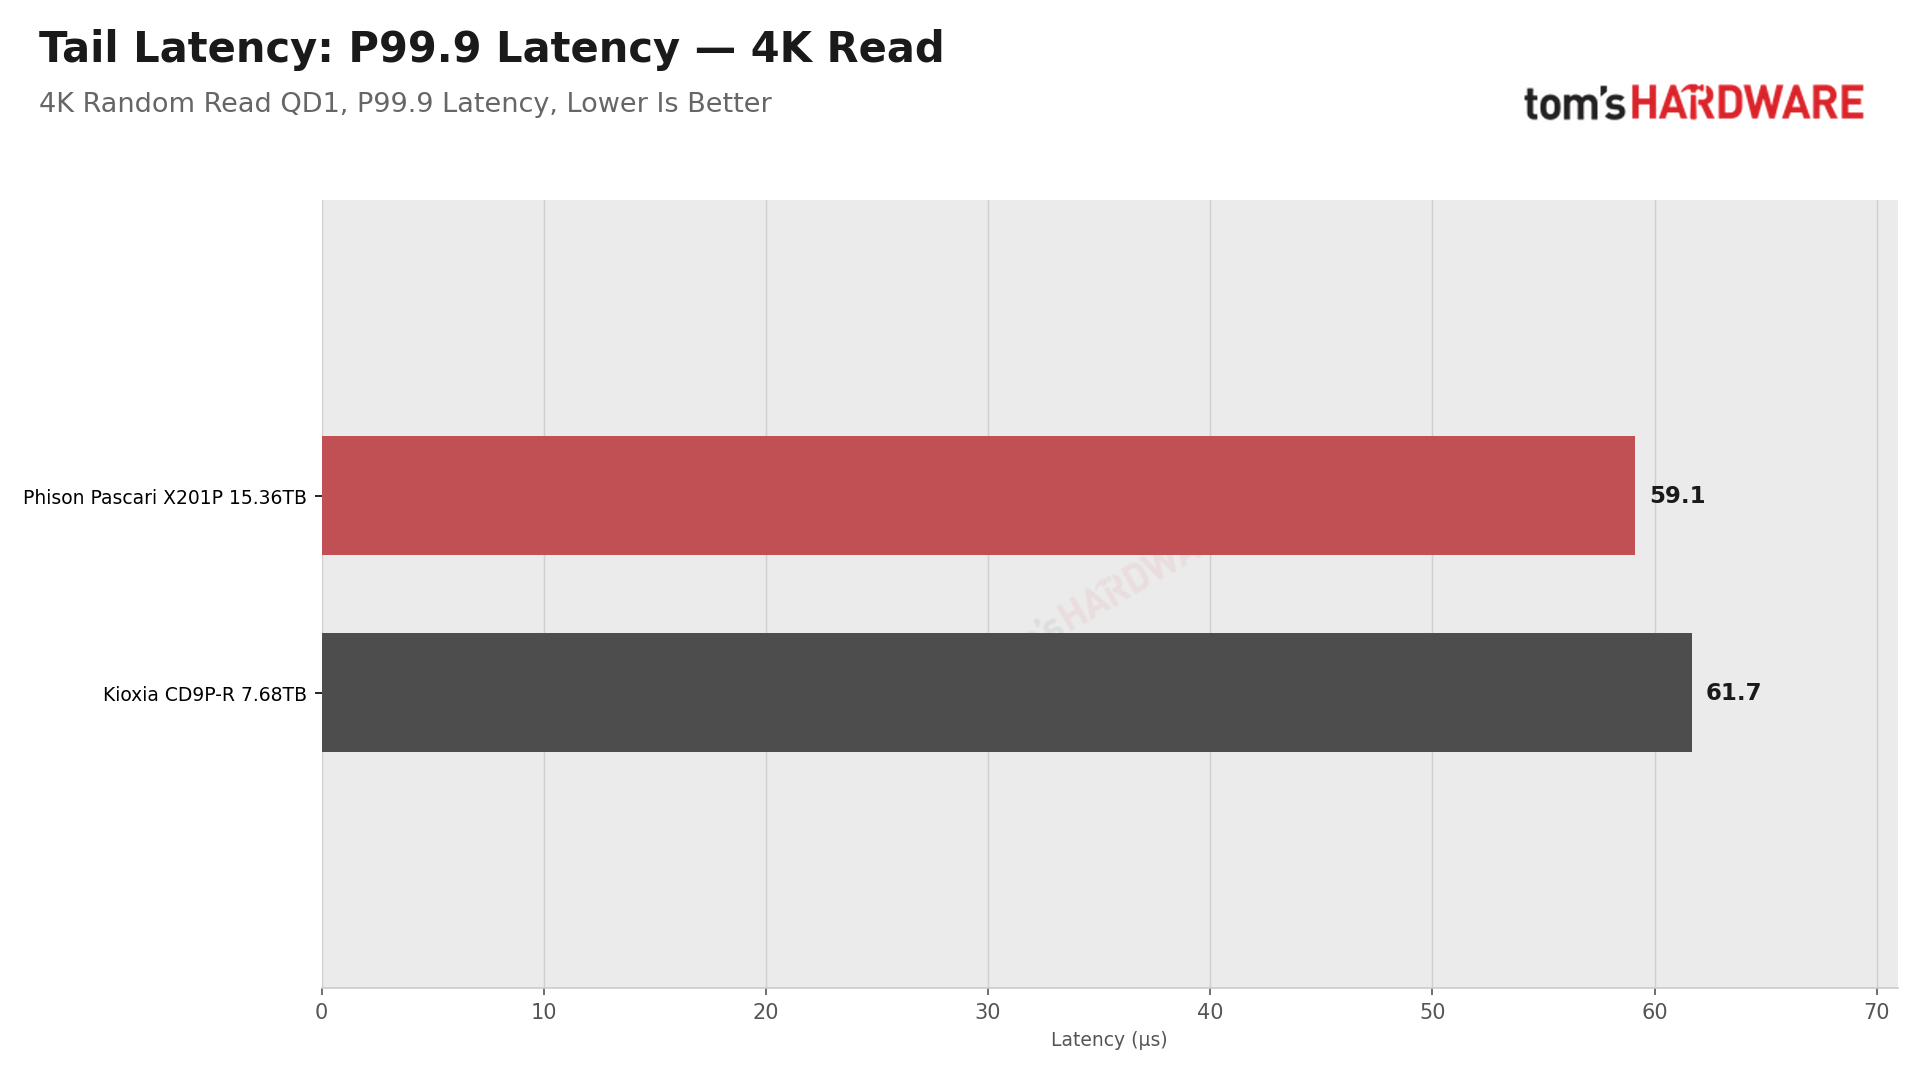
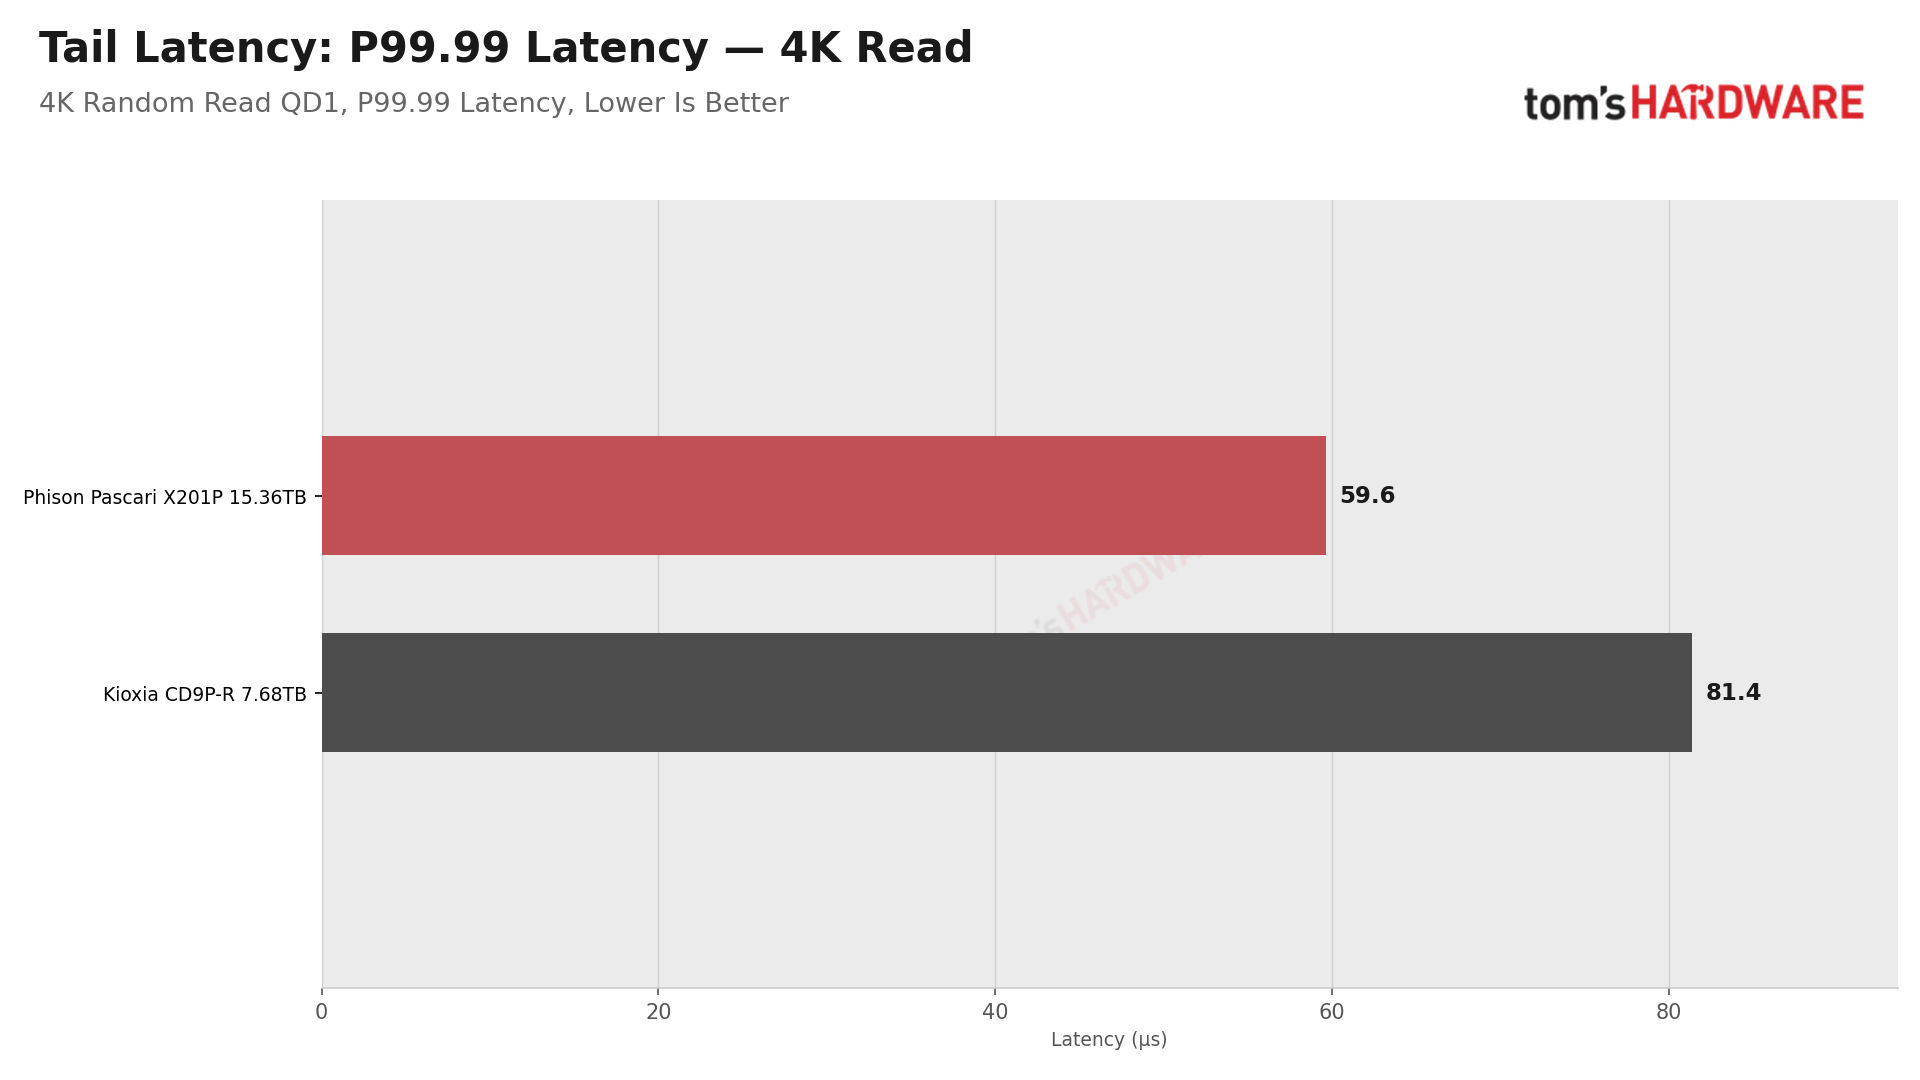
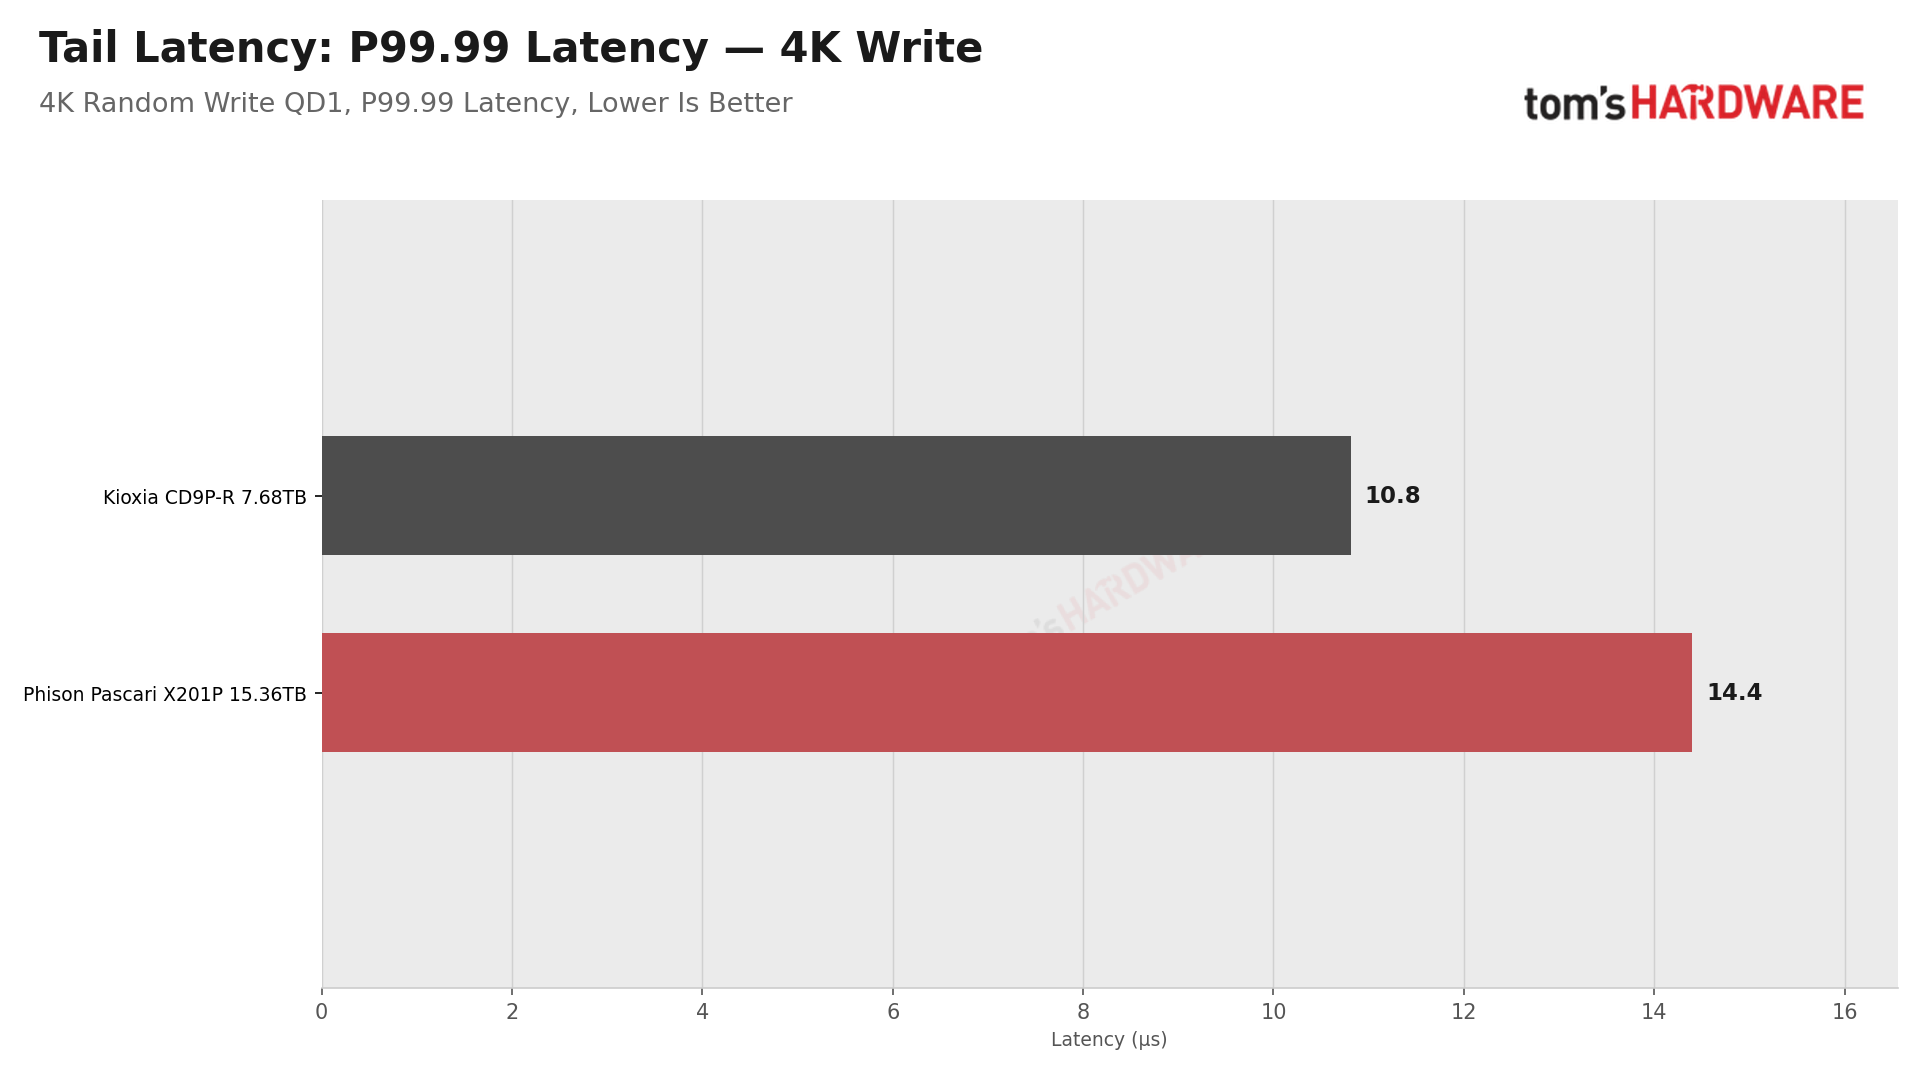
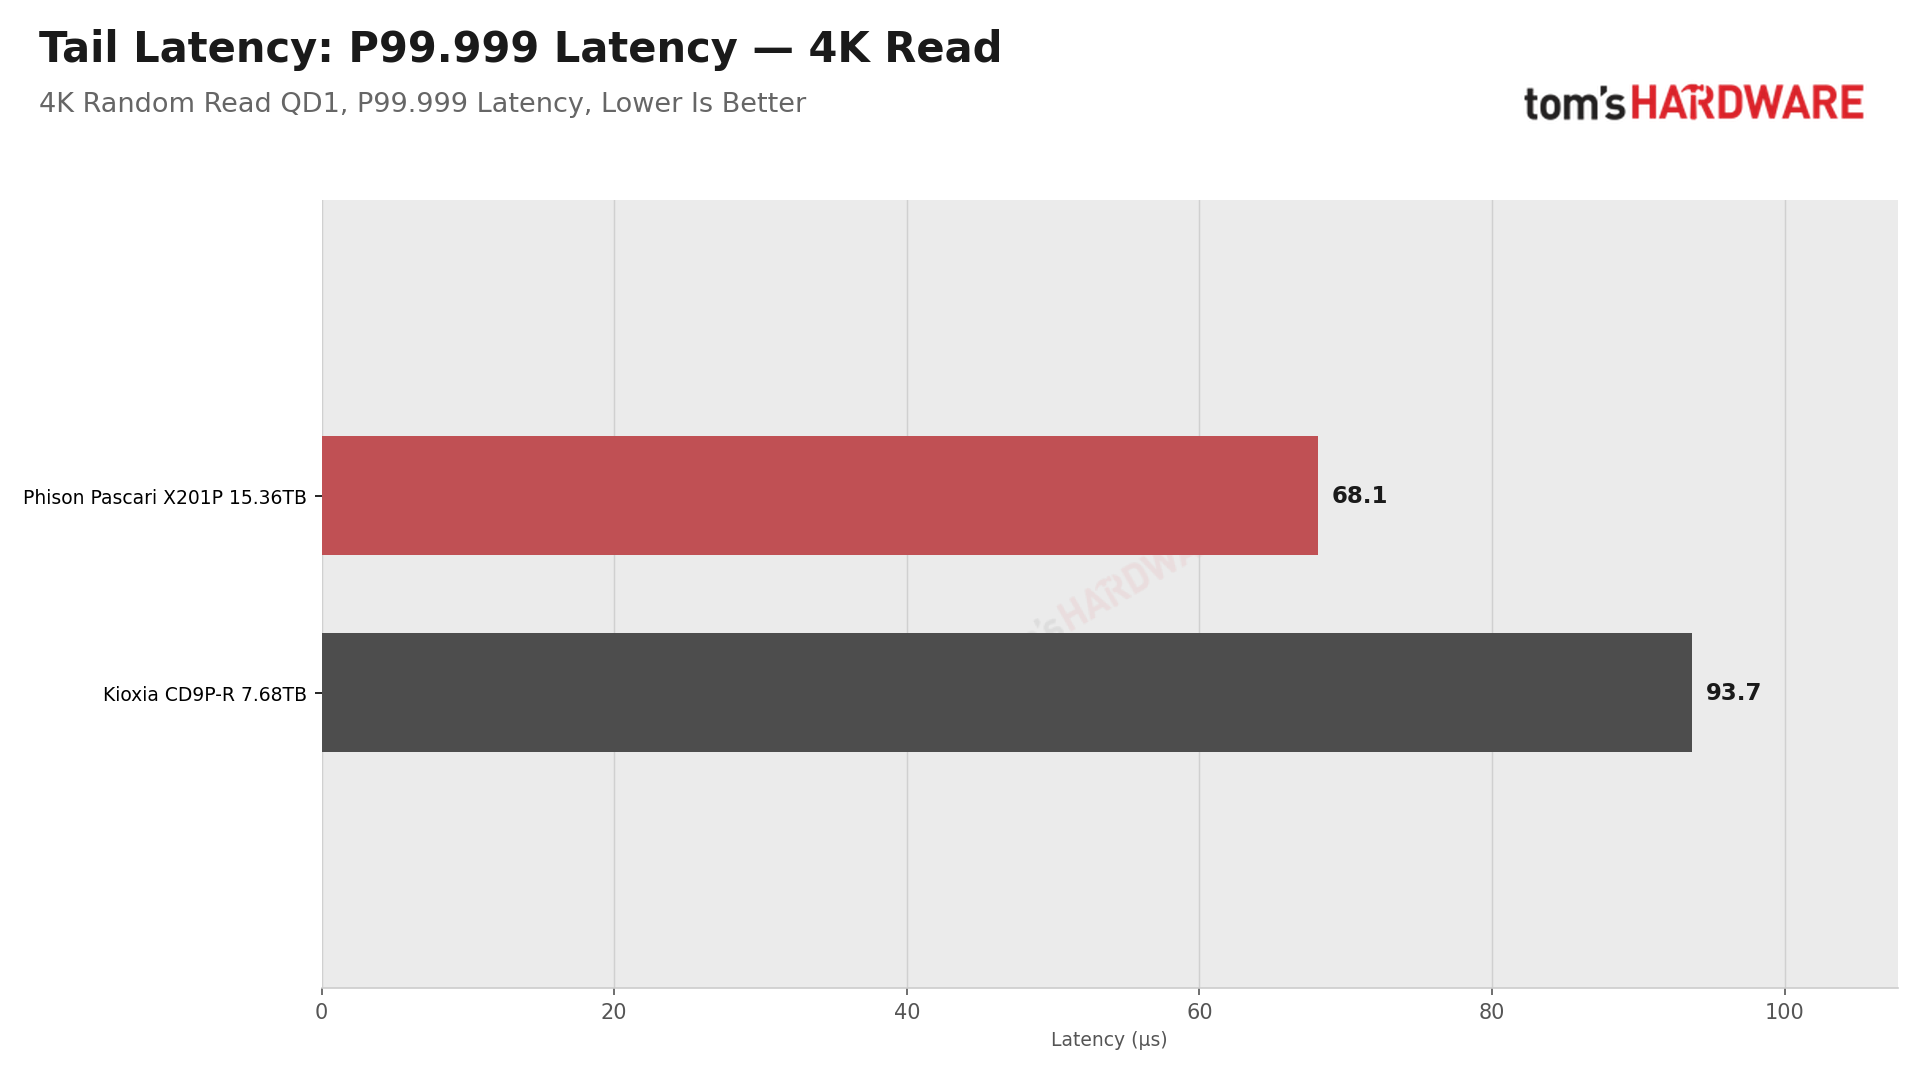
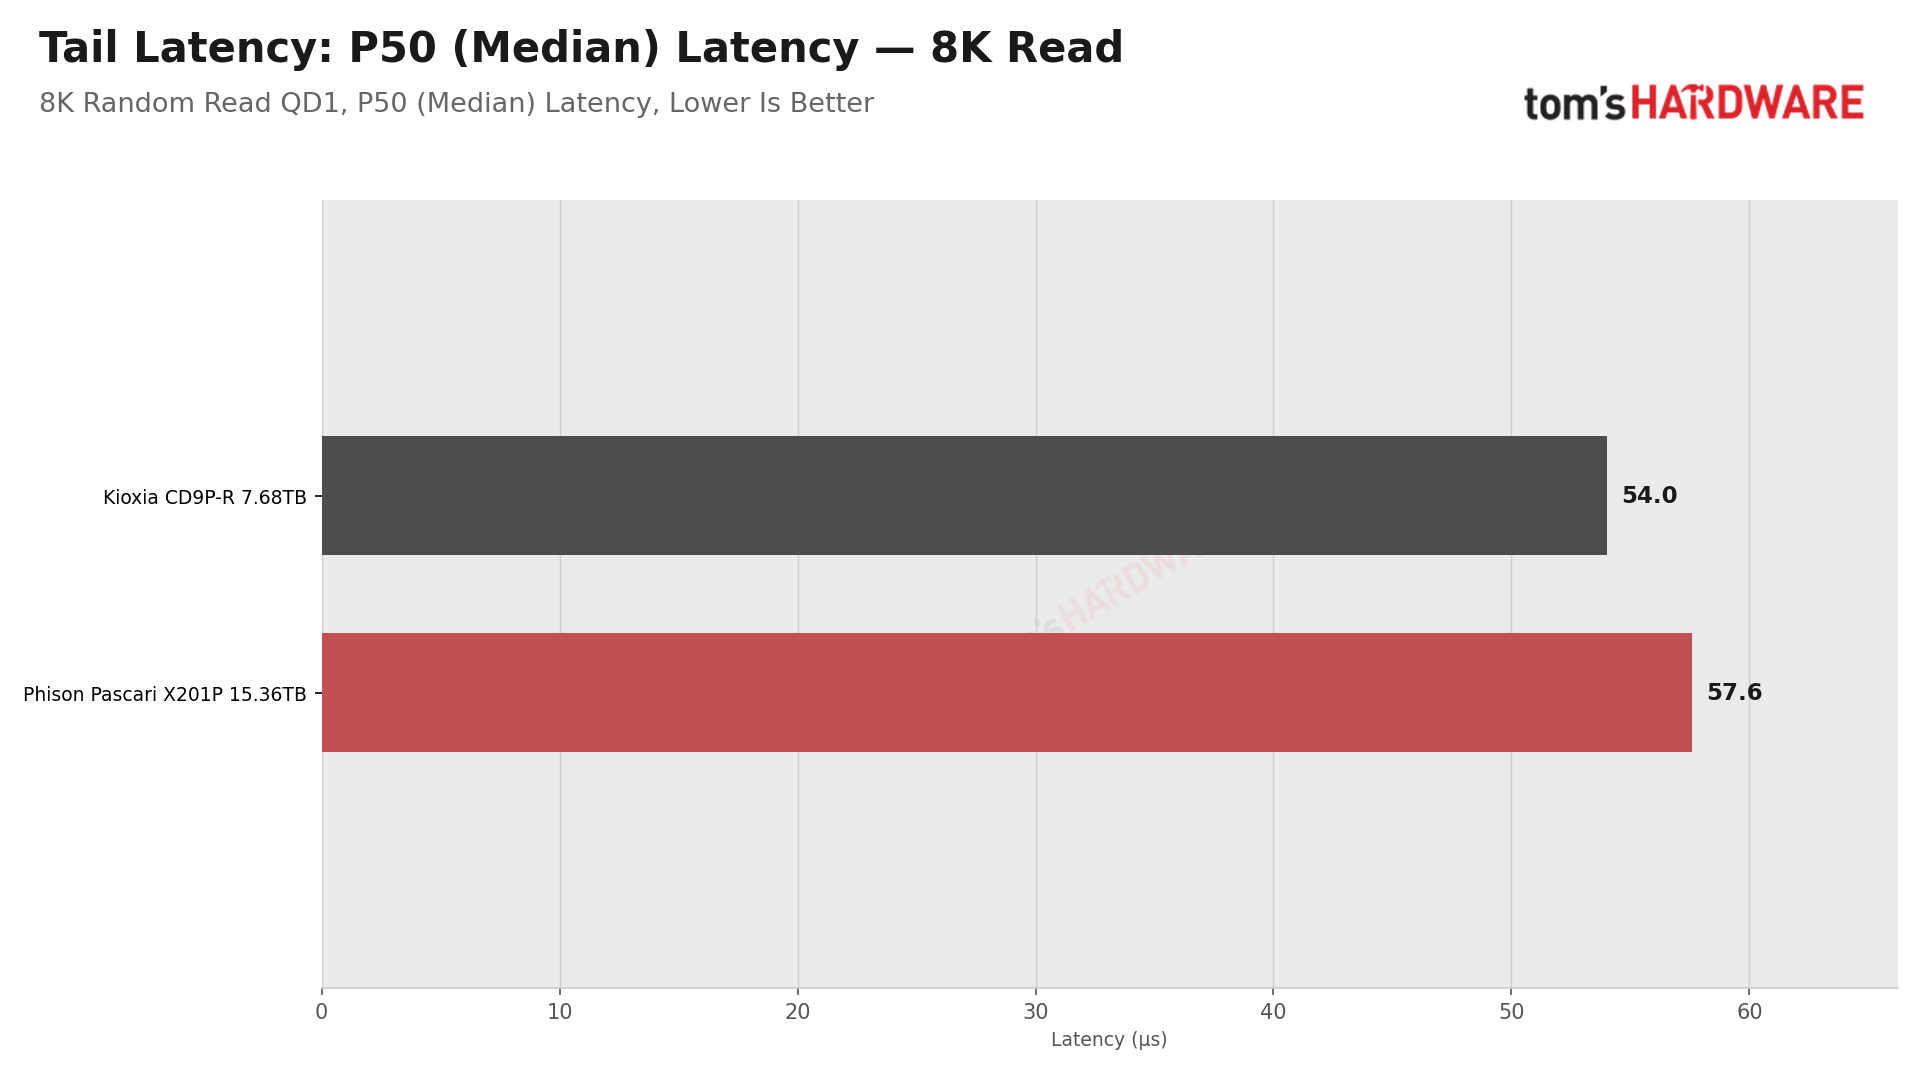
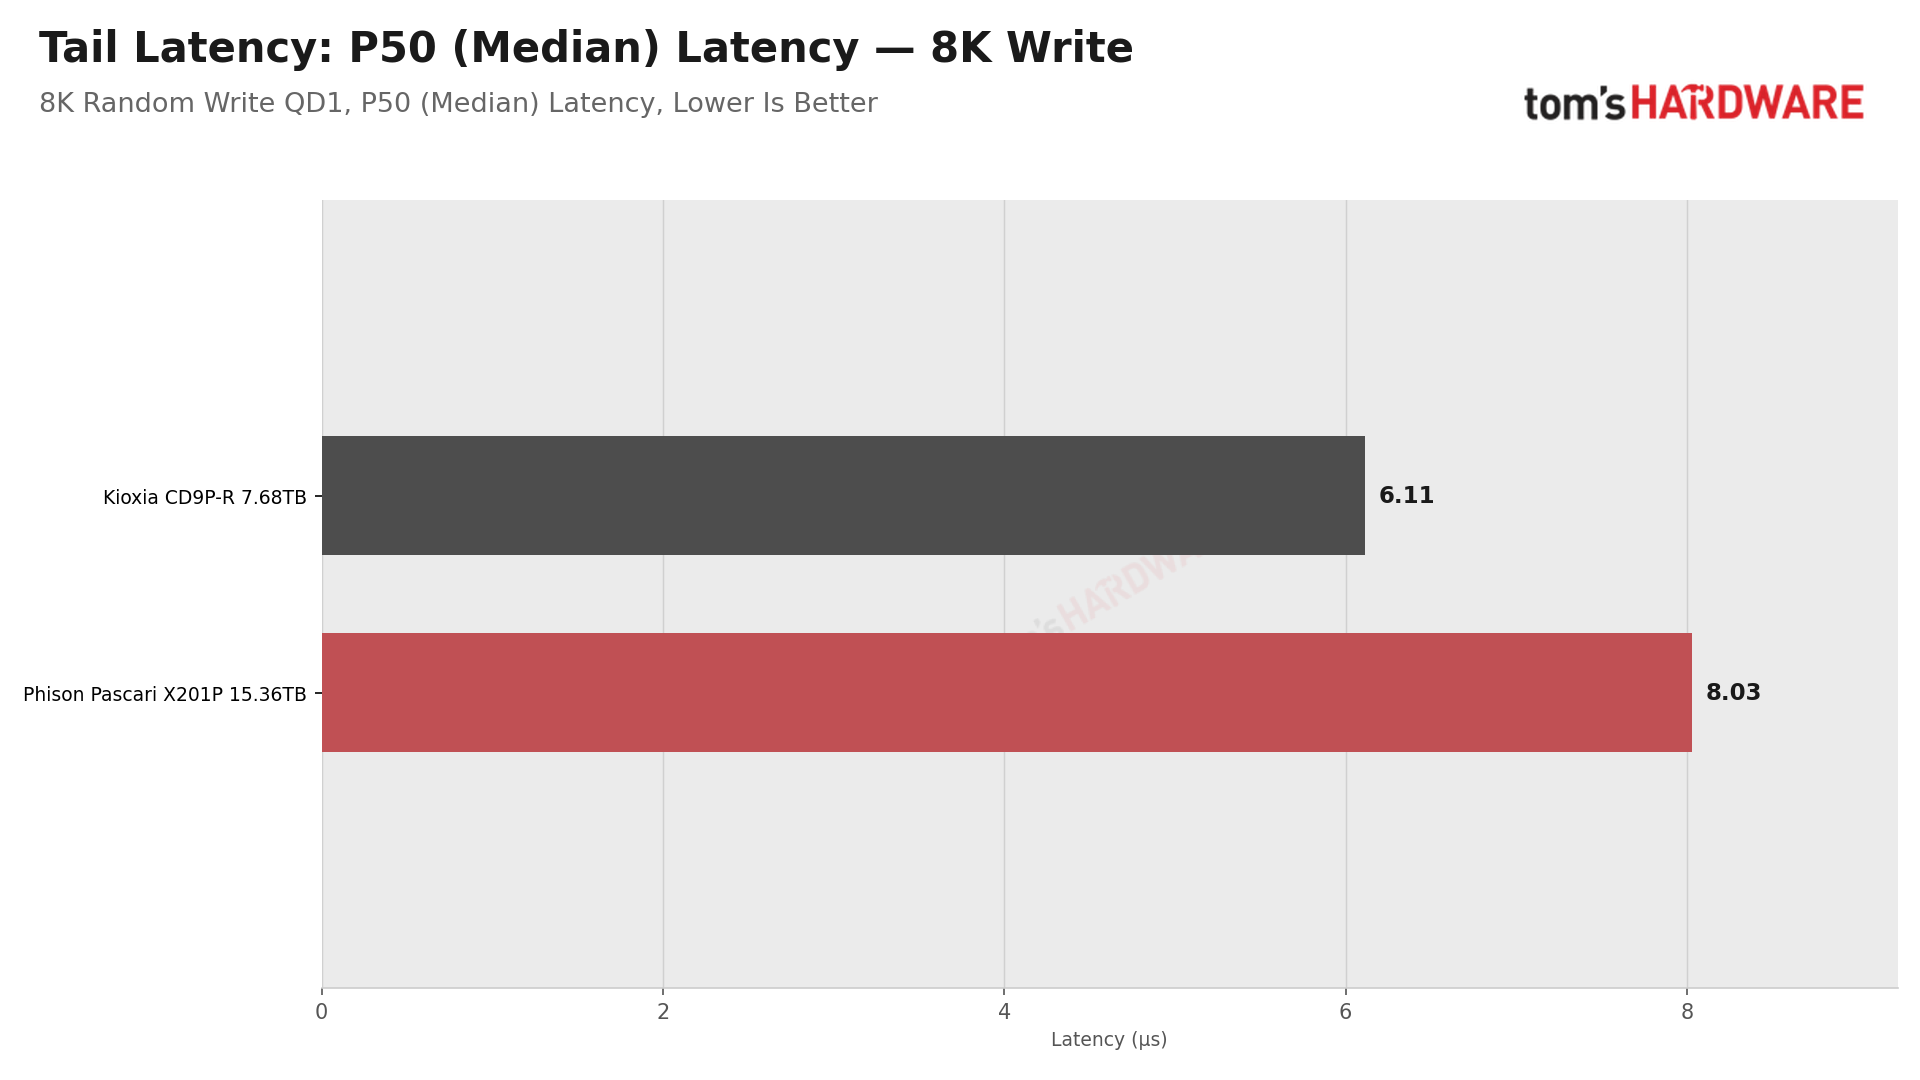
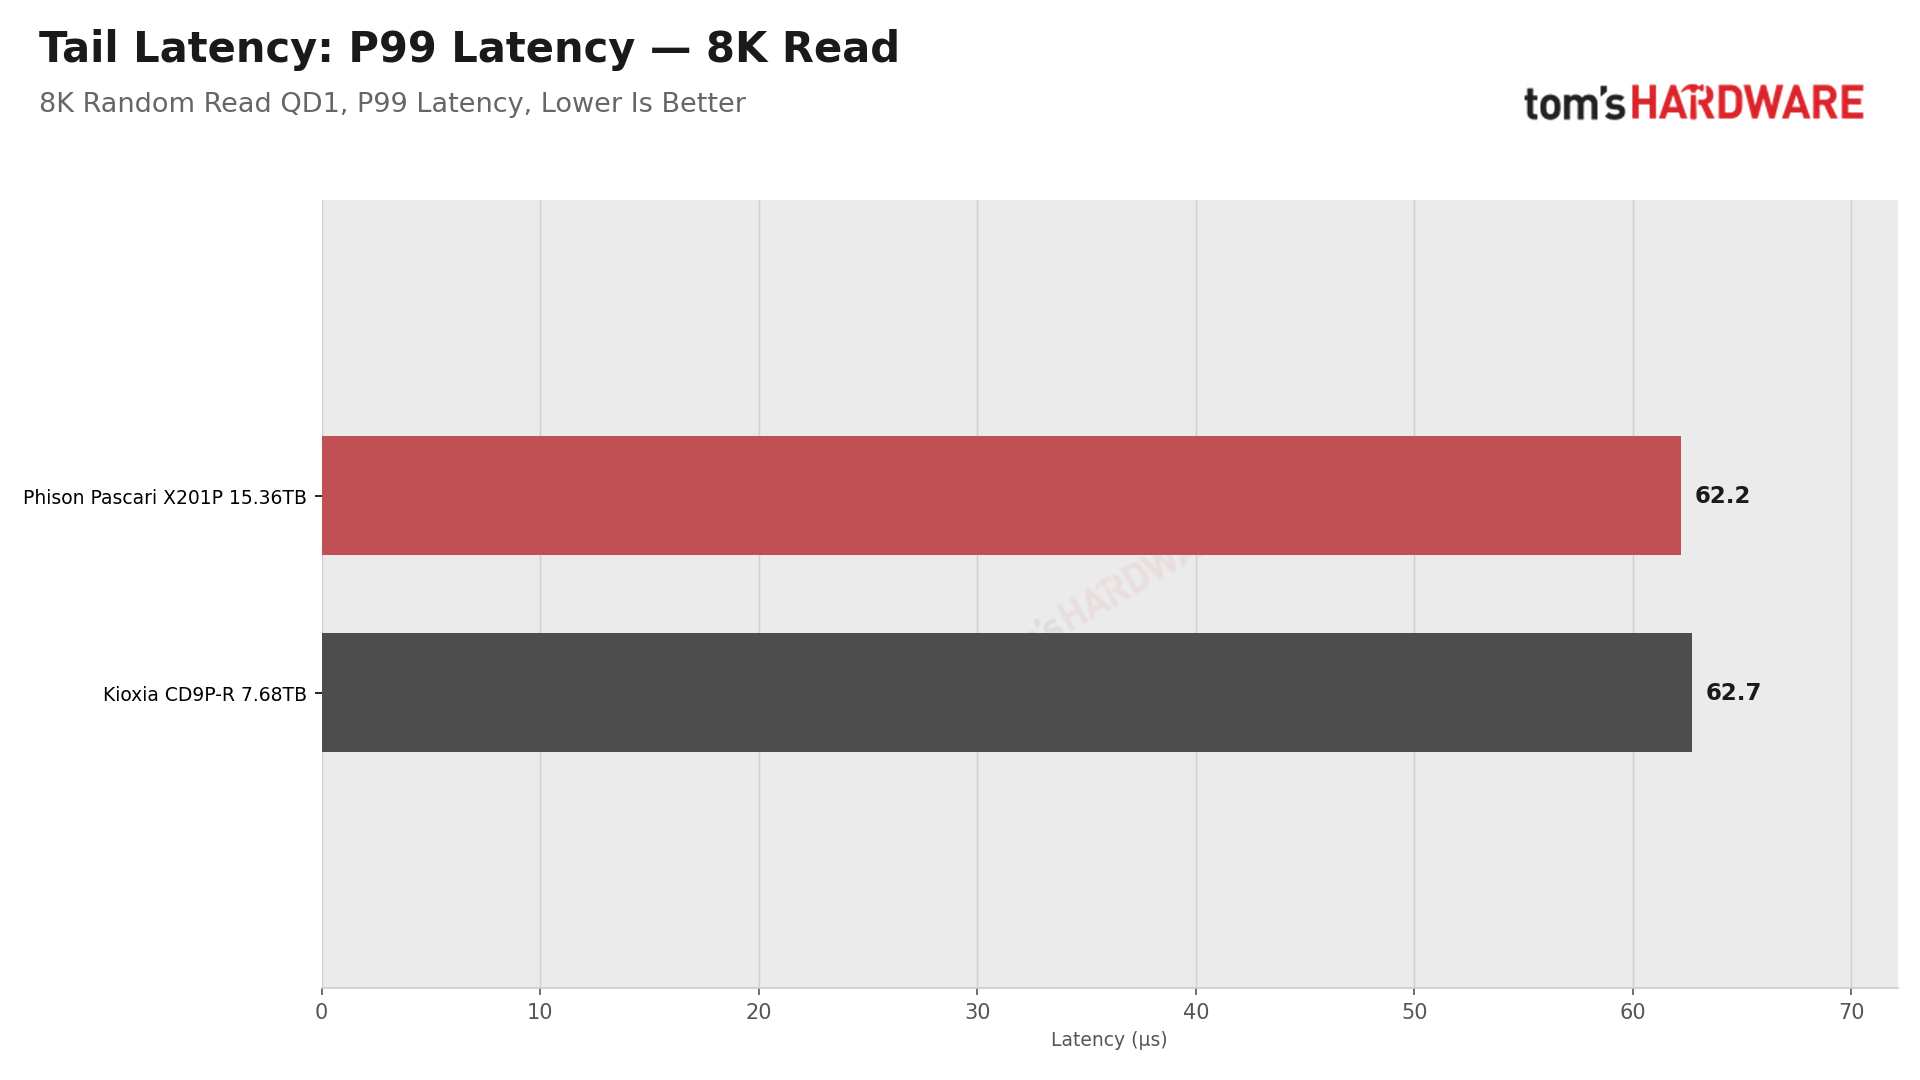
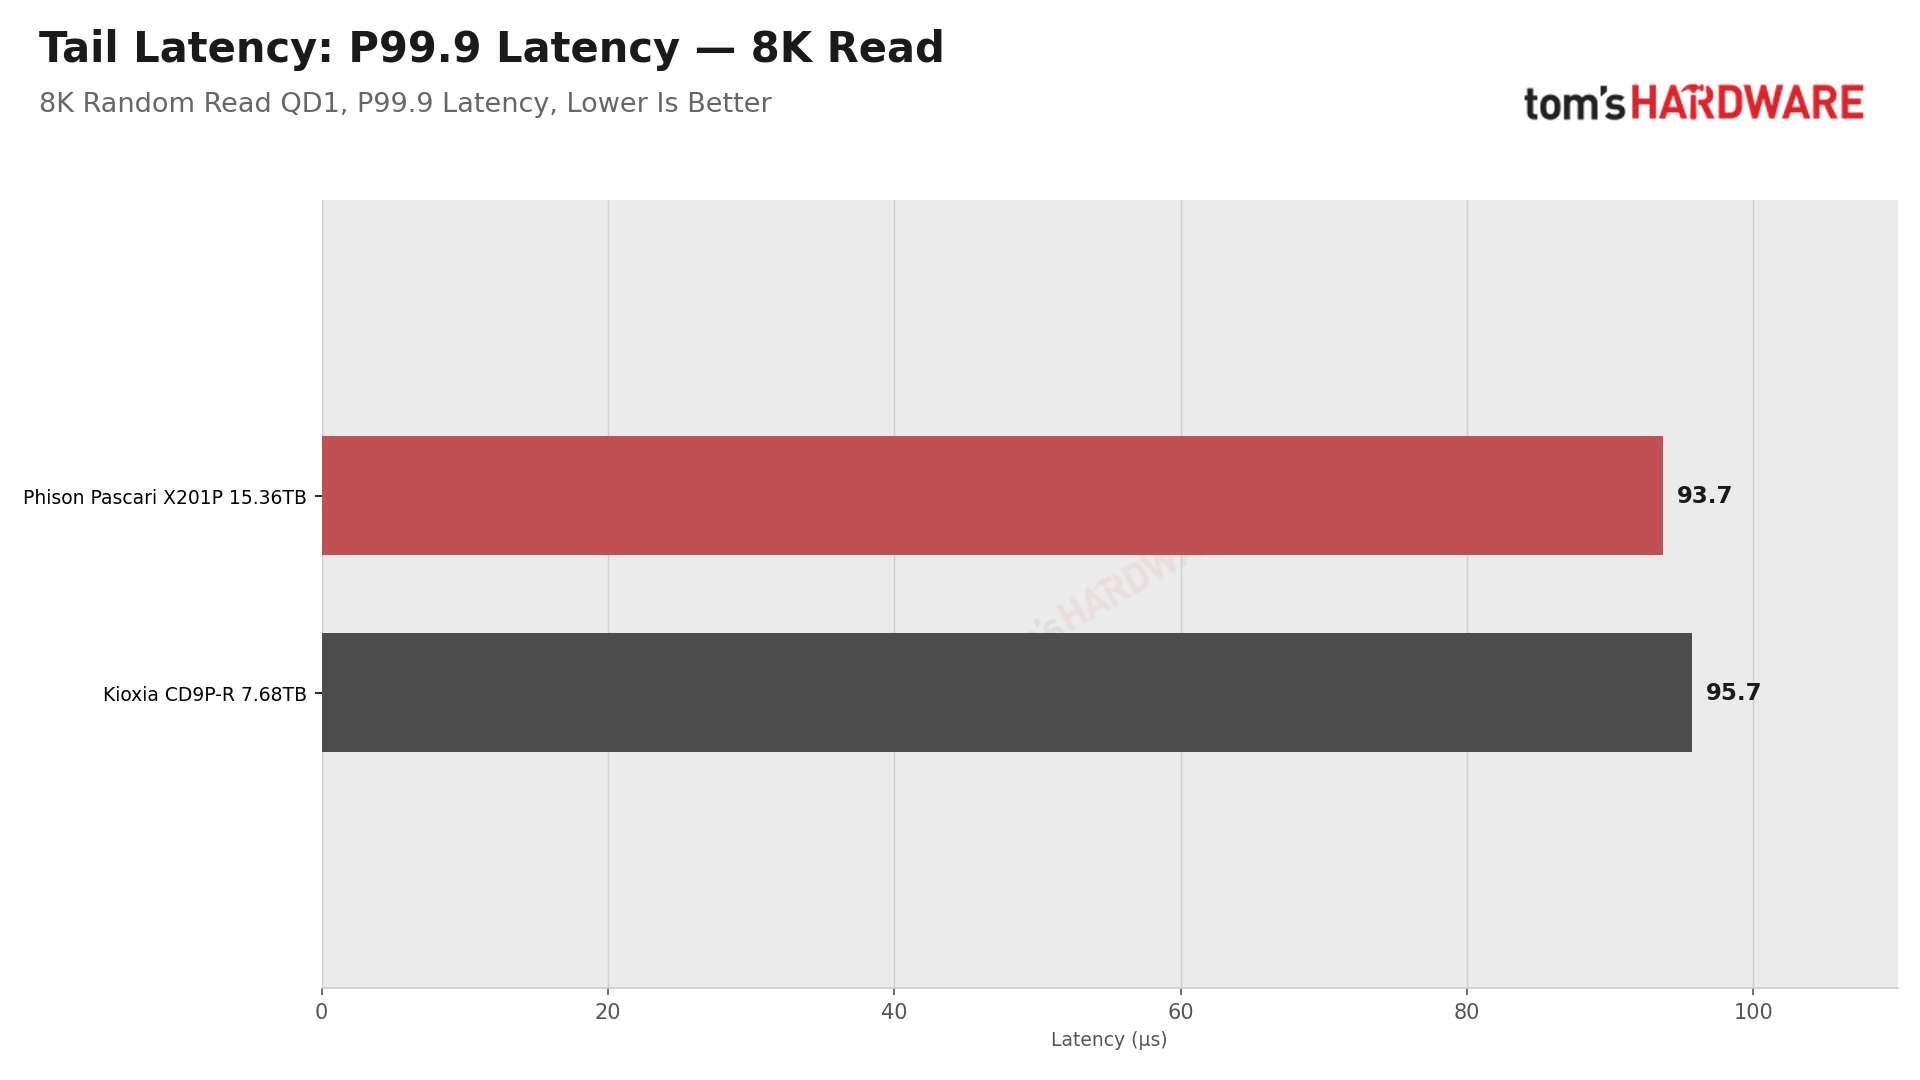
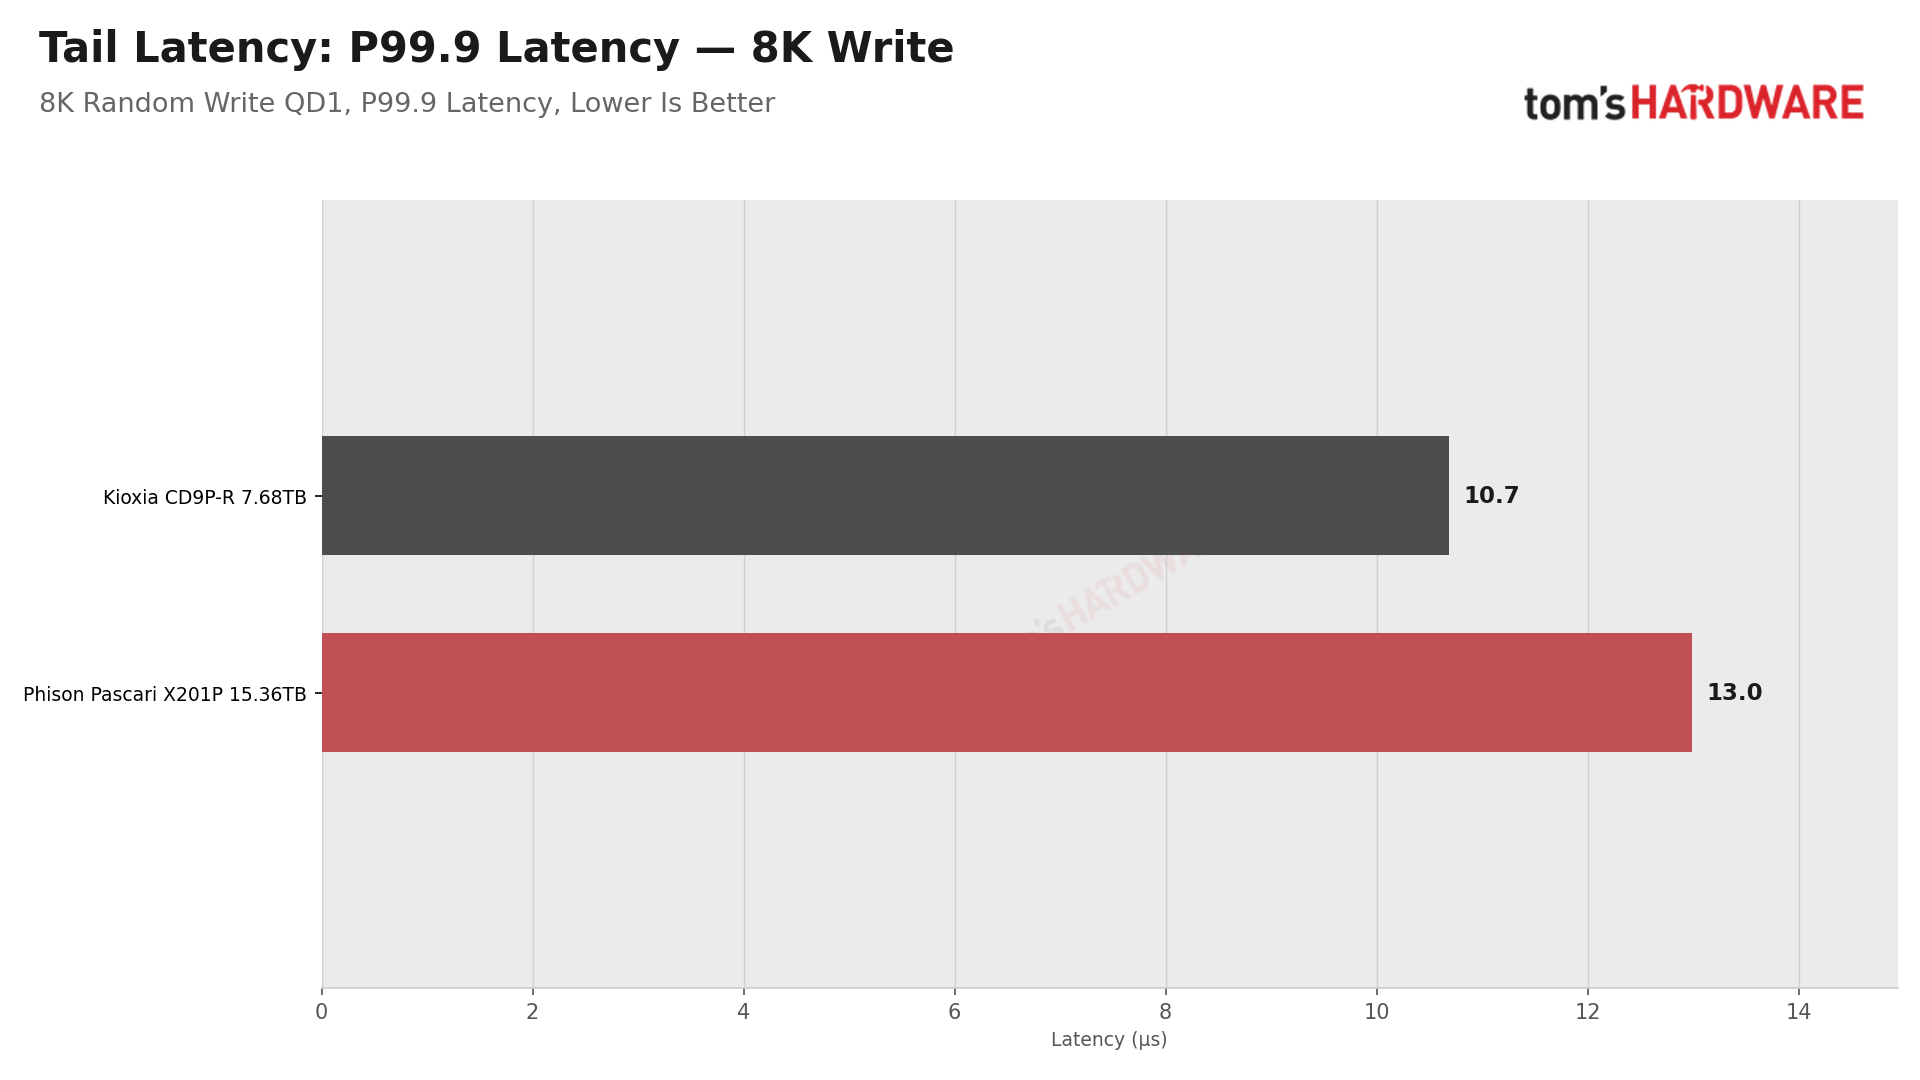
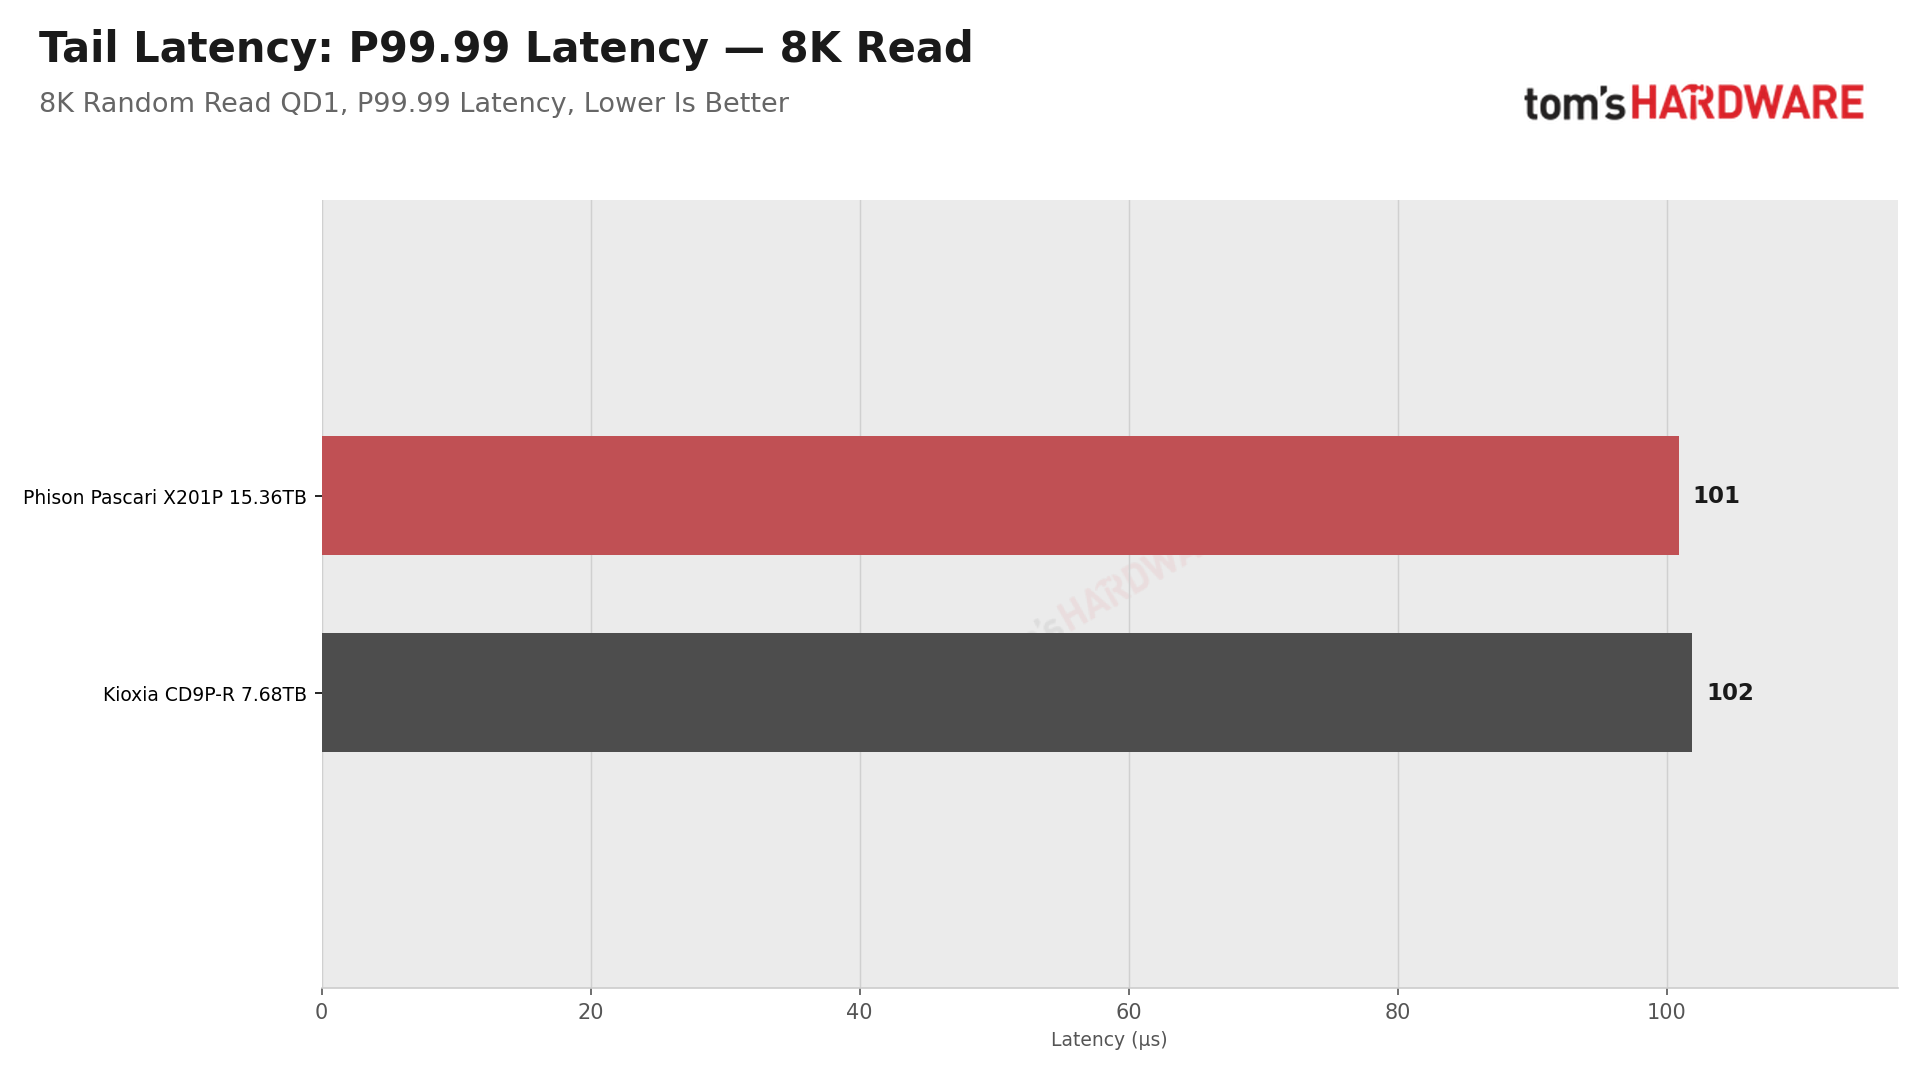
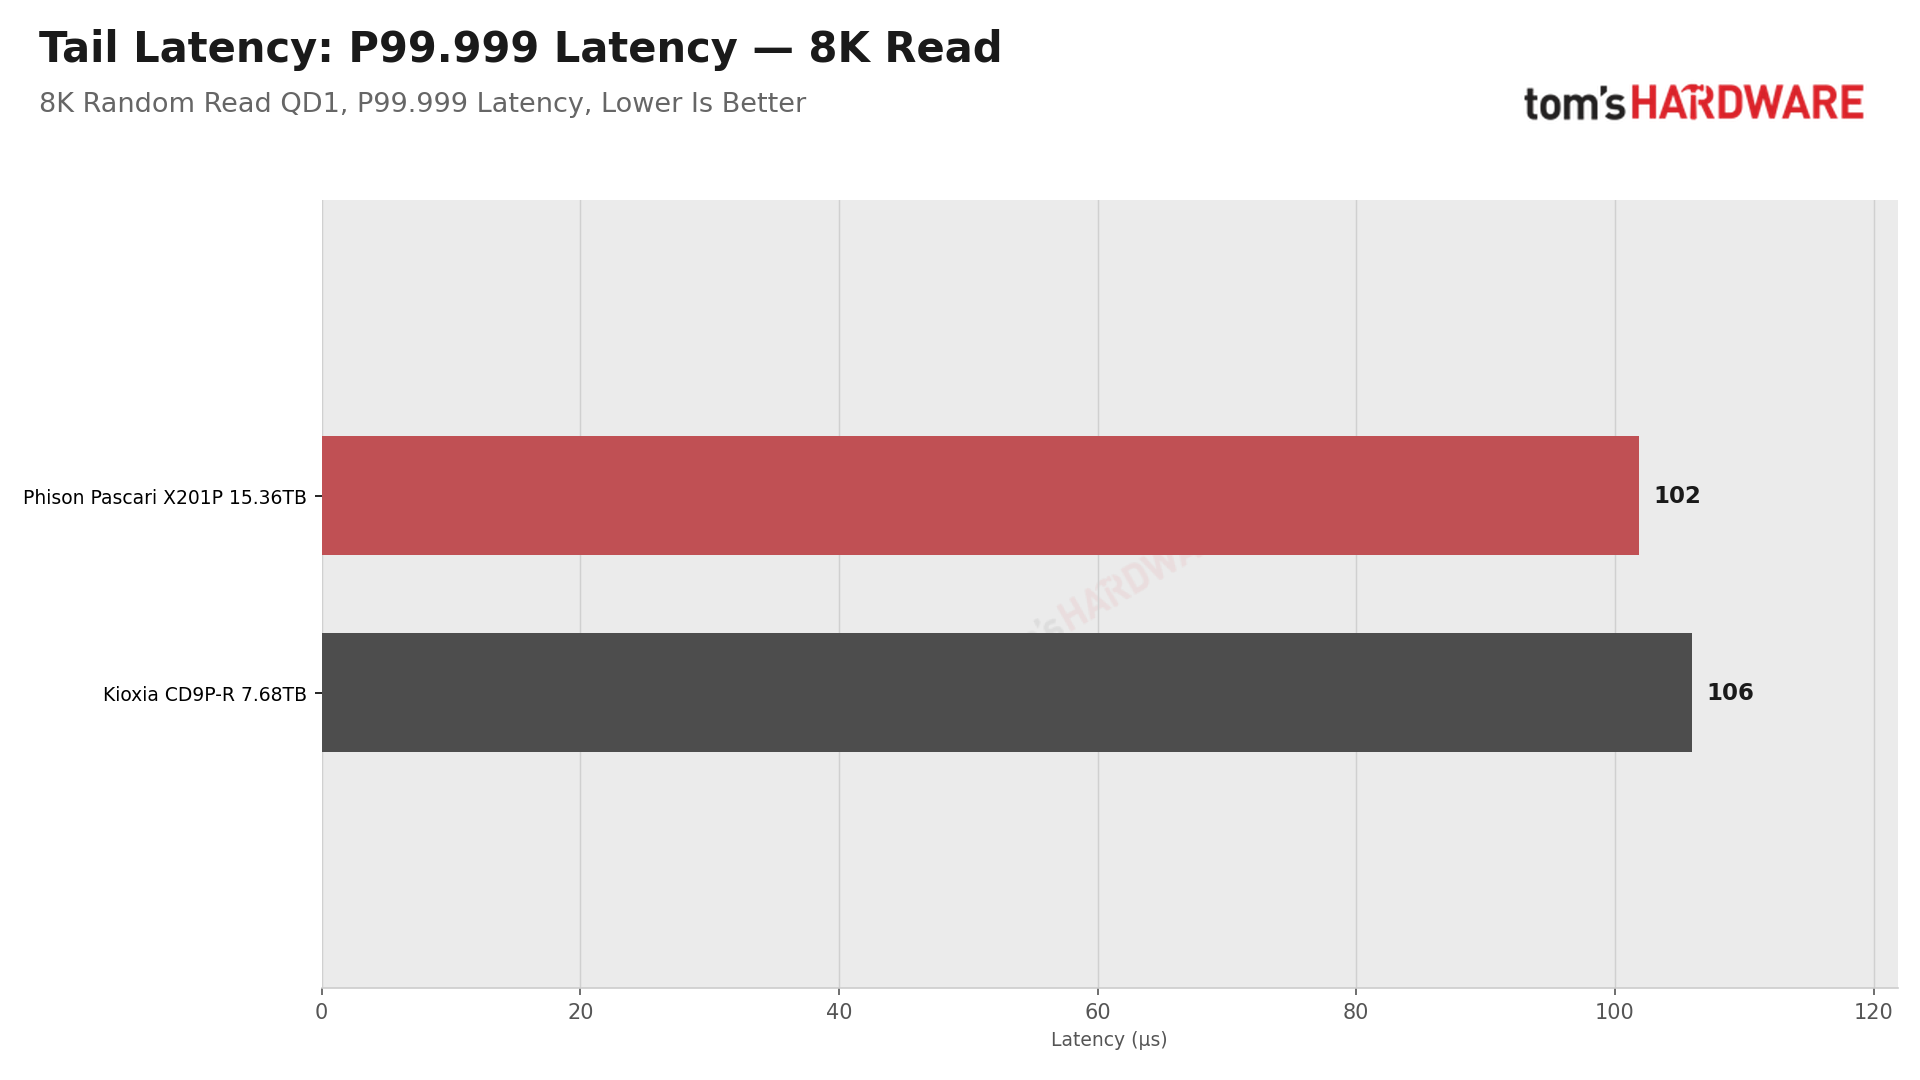
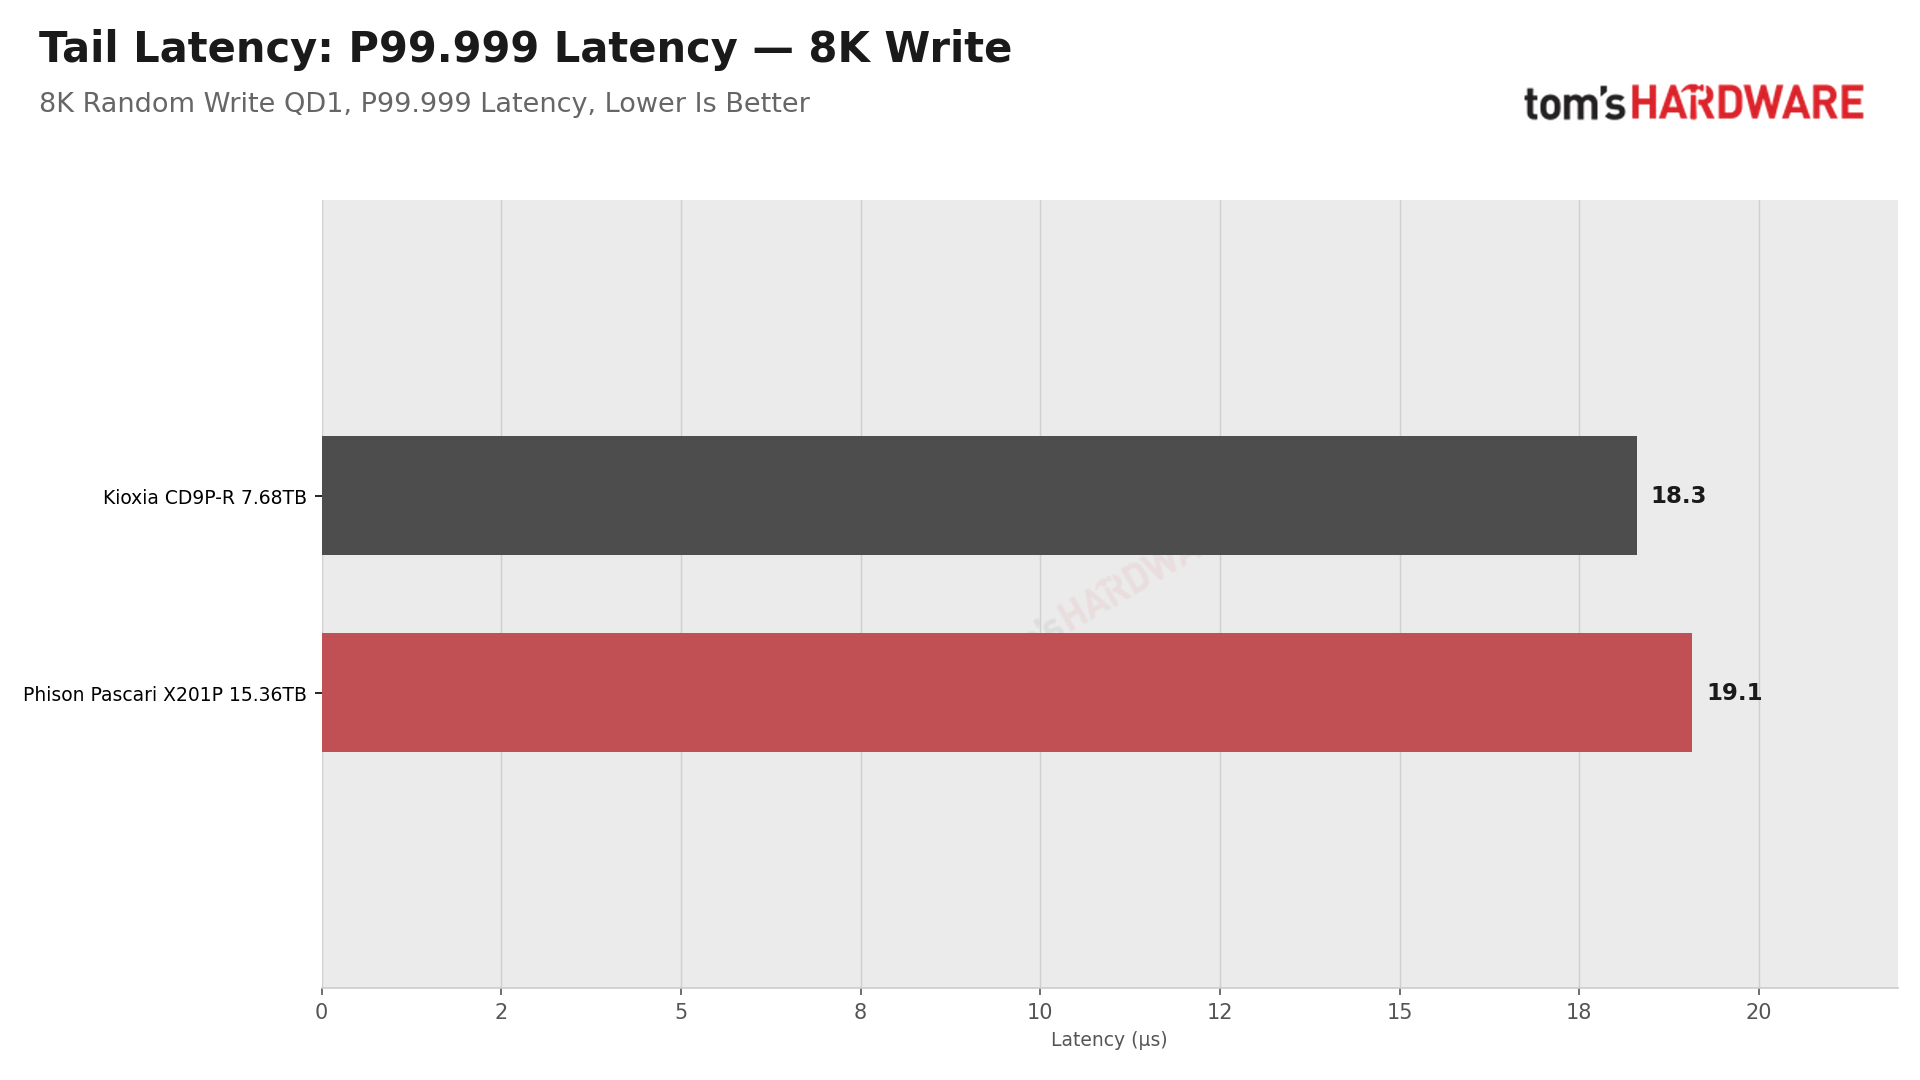
For reads, the X201P is slightly quicker at the marquee 4K and also has the cleaner deep tail, as its slowest reads at QD1 at P99.99 take 60 µs, while the CD9P-R’s take 81 µs. At 8K, though, the two are comparable, minus the X201P’s slower reads at QD16. The X201P’s 4K QD1 read average of 50.4 µs is also inside Phison’s 55 µs rating.
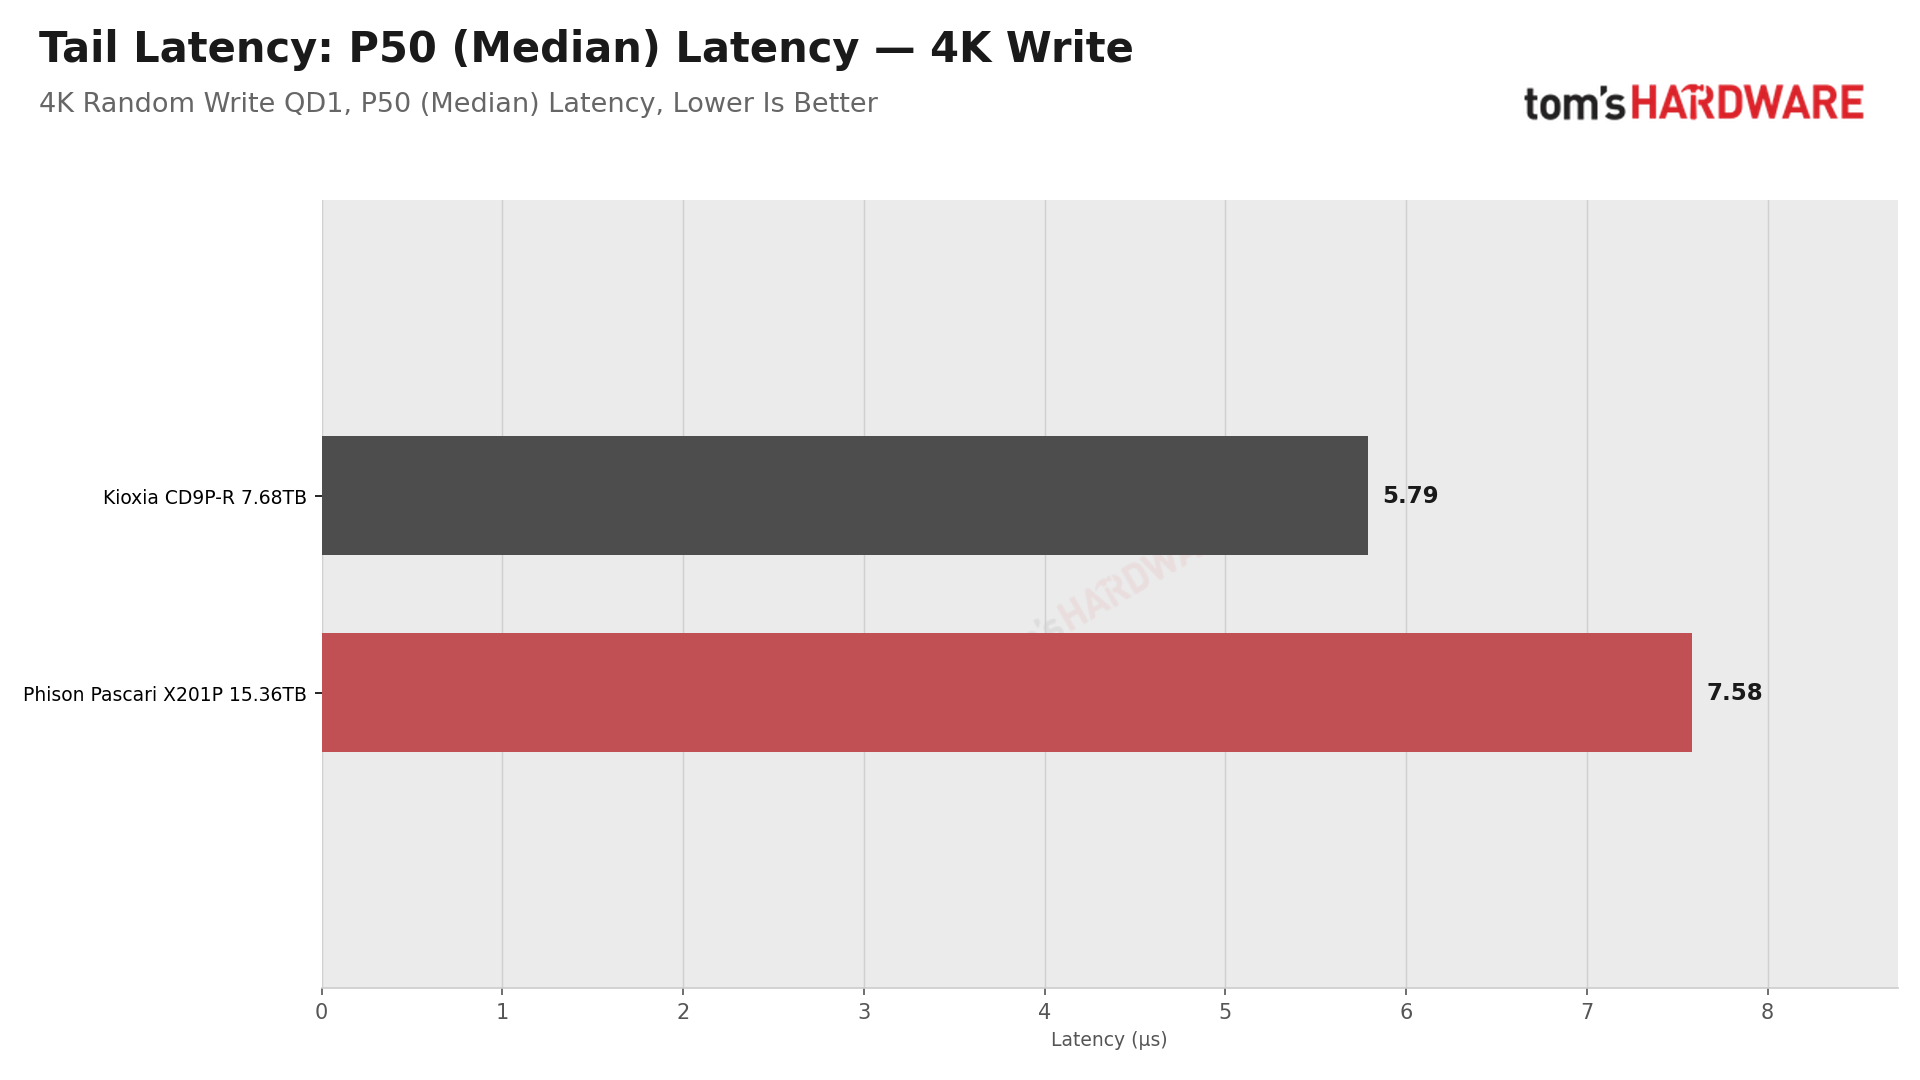
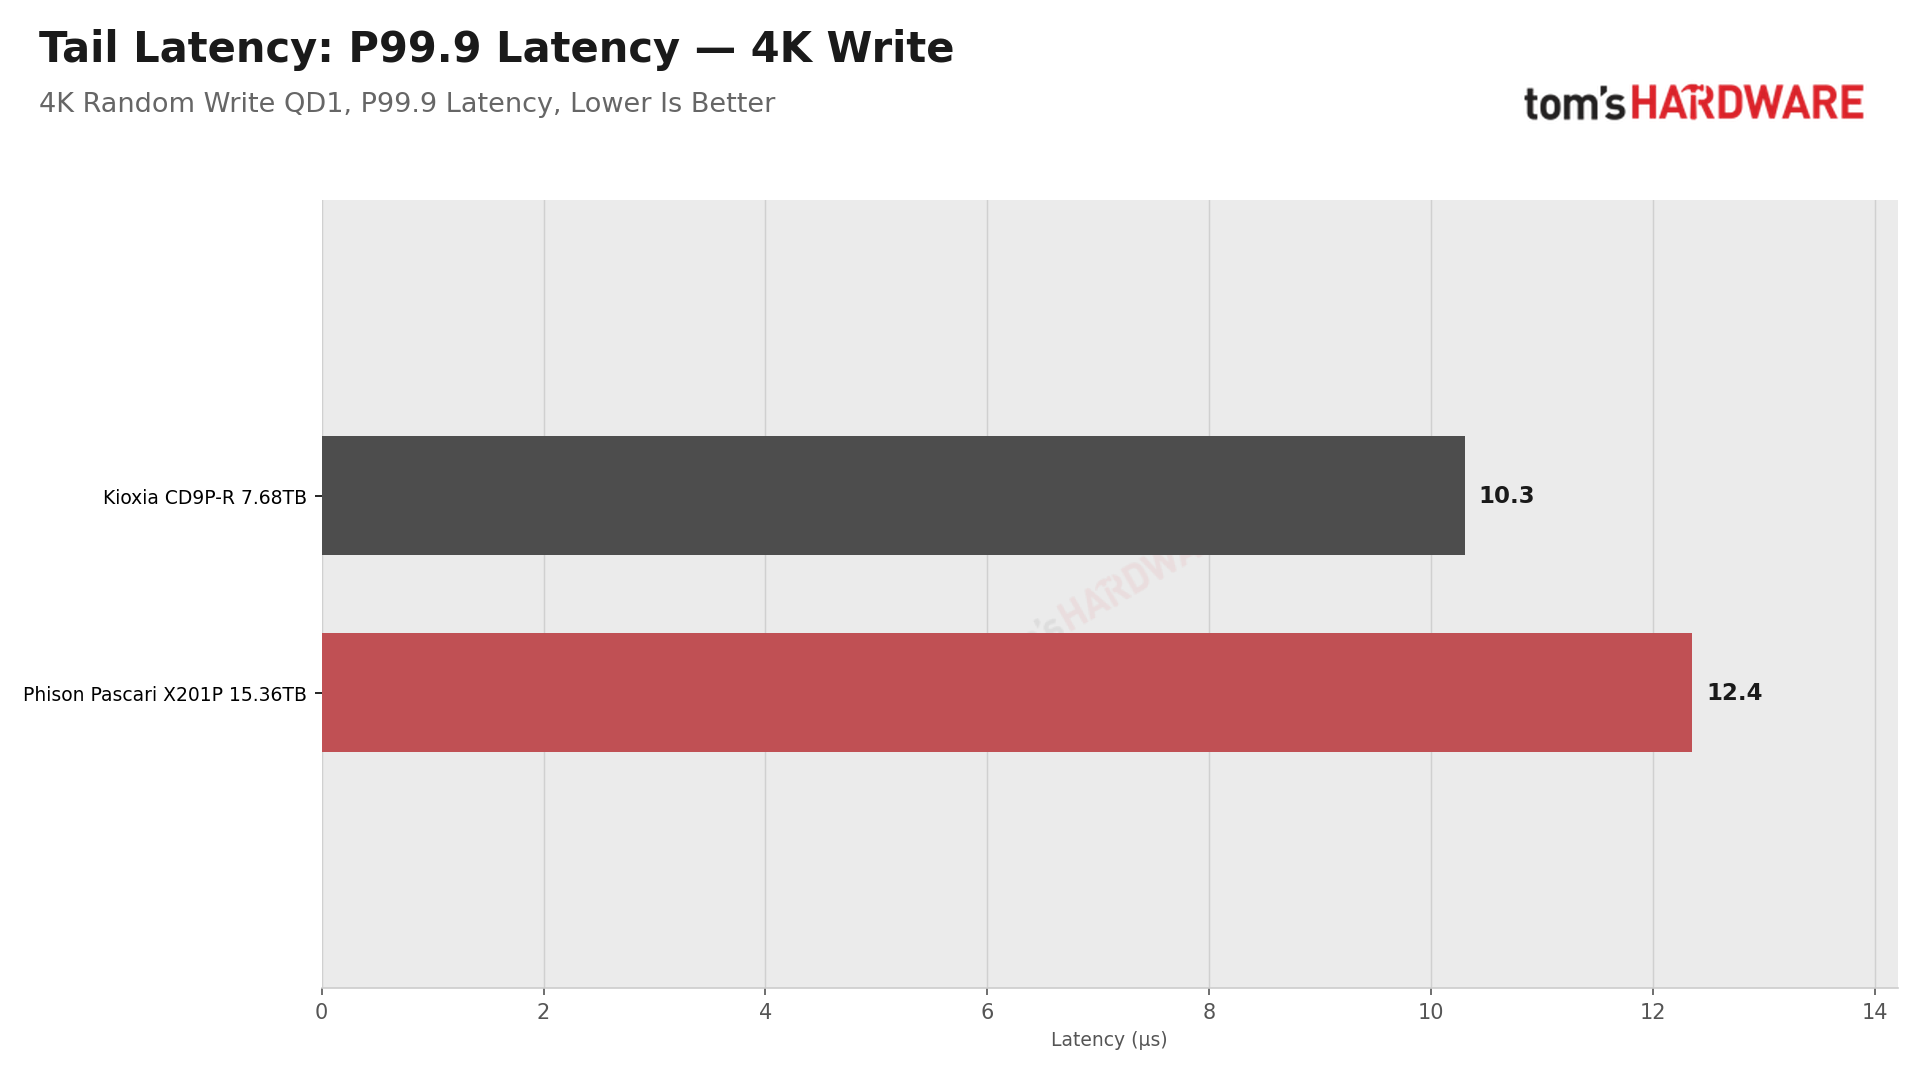
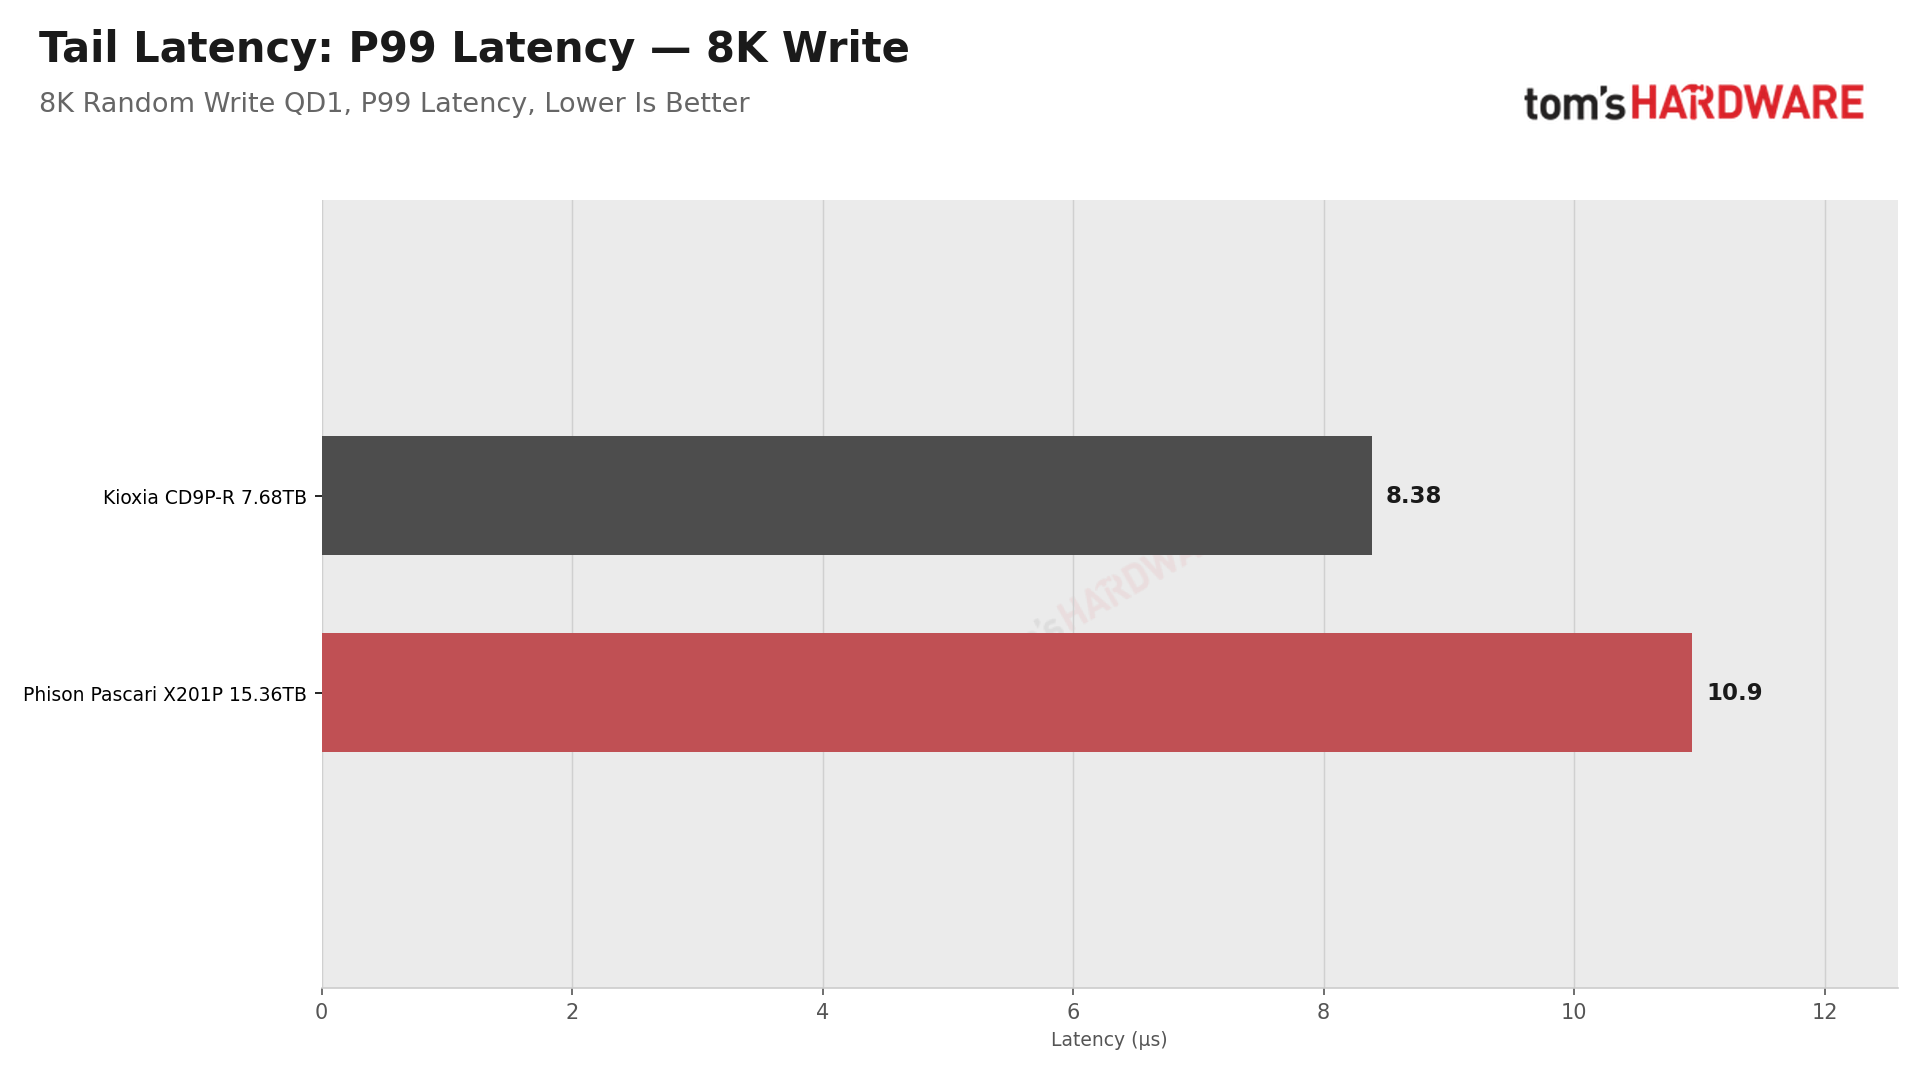
For writes, the picture changes with queue depth. The CD9P-R is faster everywhere at QD1 but, once there is any sort of queue, the X201P becomes the predictable one: its 4K write P99 stays within about 2.5 µs of its median at QD1, QD4, and QD16, while the other drive’s P99 climbs to three and four times its median at QD4 and QD16. At QD16, that’s a P99 of 27 µs for the X201P against 75 µs. The CD9P-R still delivers most writes sooner, but a minority wait, and on the X201P almost none do.
Because QD1 numbers catch headlines, we’ll note here again that on our bench, since we go interrupt-driven rather than polling, there is an addition of about 1.2 to 1.4 µs to each I/O at that depth. This means that other reviews and data may show lower numbers — which is faster when looking at latency — especially with IOMMU disabled. Our QD1 figures are therefore not directly comparable with other outlets’ figures. The decision is explained in our testing notes.
Latency and QoS — Saturation Curve
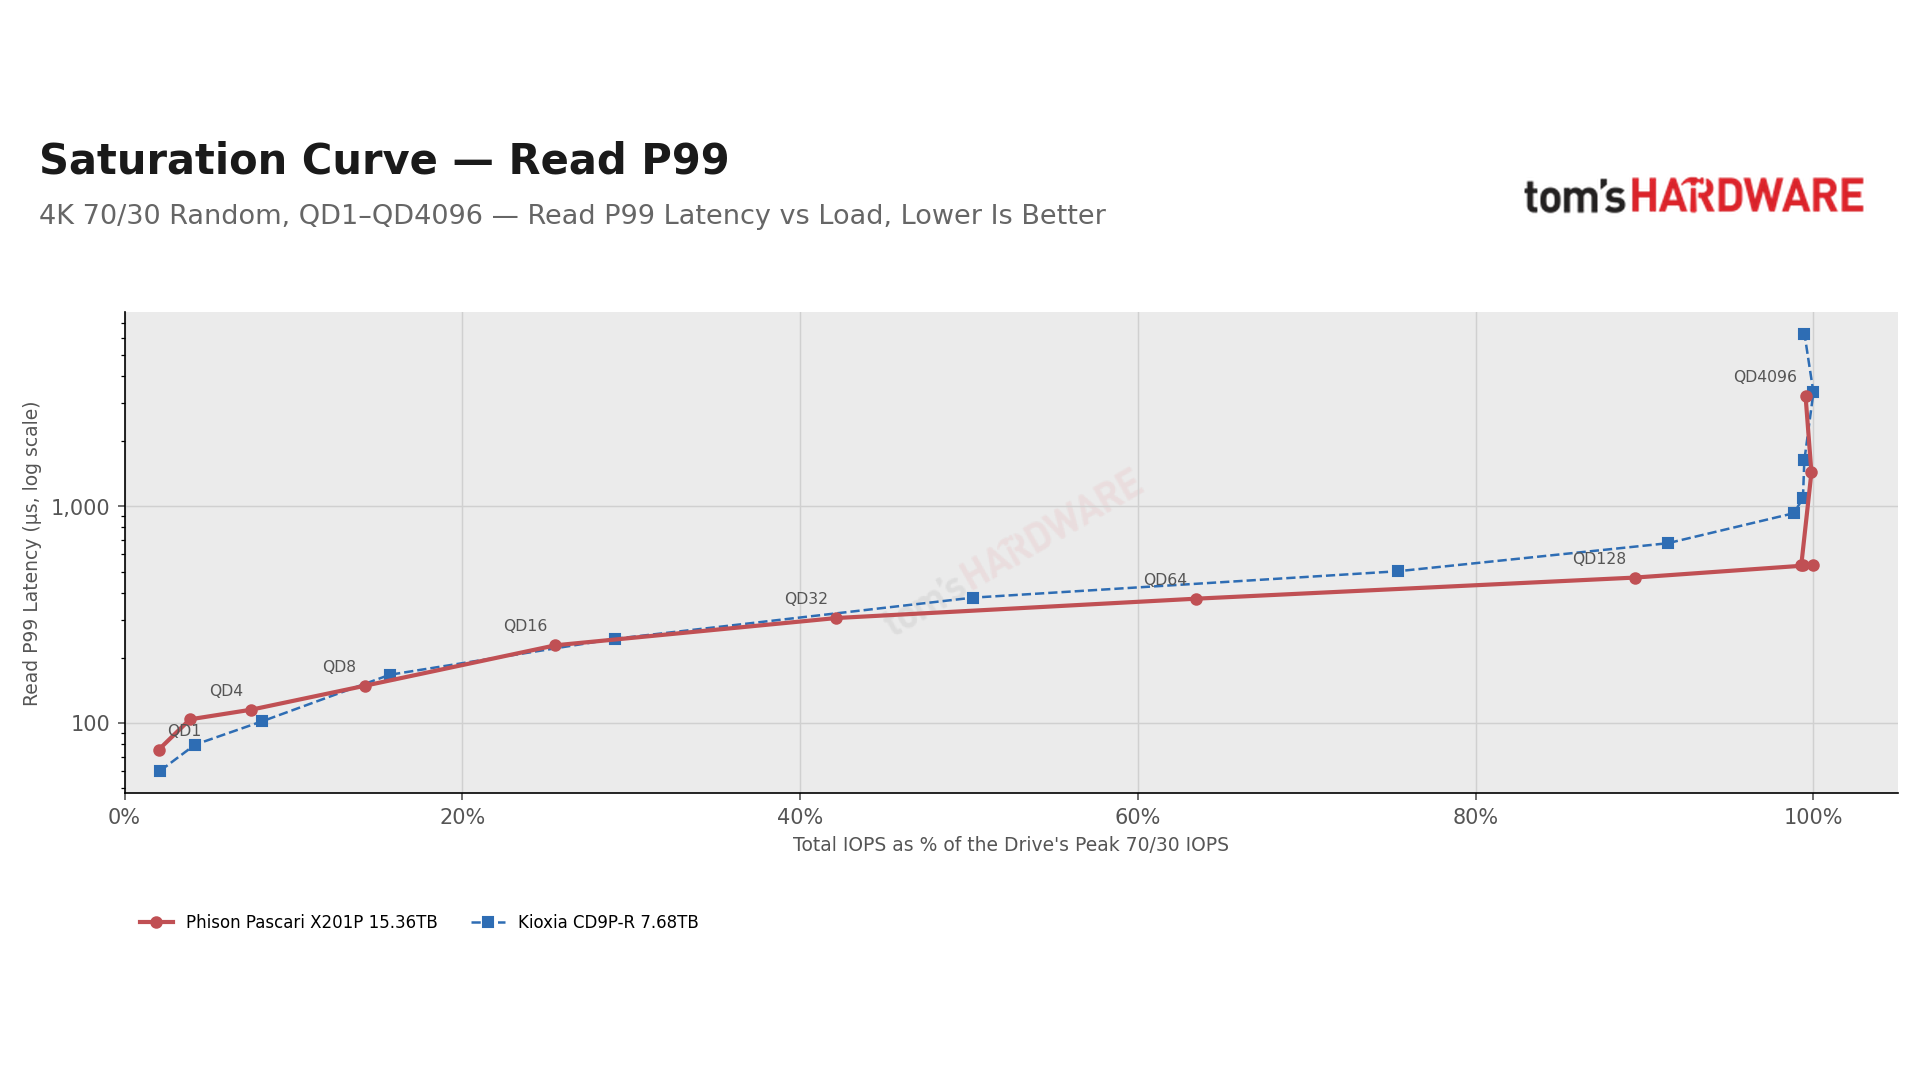
No one runs a production server at the absolute limit of its storage, because latency climbs steeply as a drive approaches full load. The practical question is how hard you can push a drive before its response times take off. Our saturation curve plots P99 latency against load, using the 4K 70/30 results from the random sweep at 13 queue depths. Each point sits at its share of the drive's own peak 70/30 throughput, so fast and slow drives share the same scale. Read and write latency get separate charts. The knee, where latency turns sharply upward, marks the practical operating ceiling: the load you can plan around without giving up responsiveness.
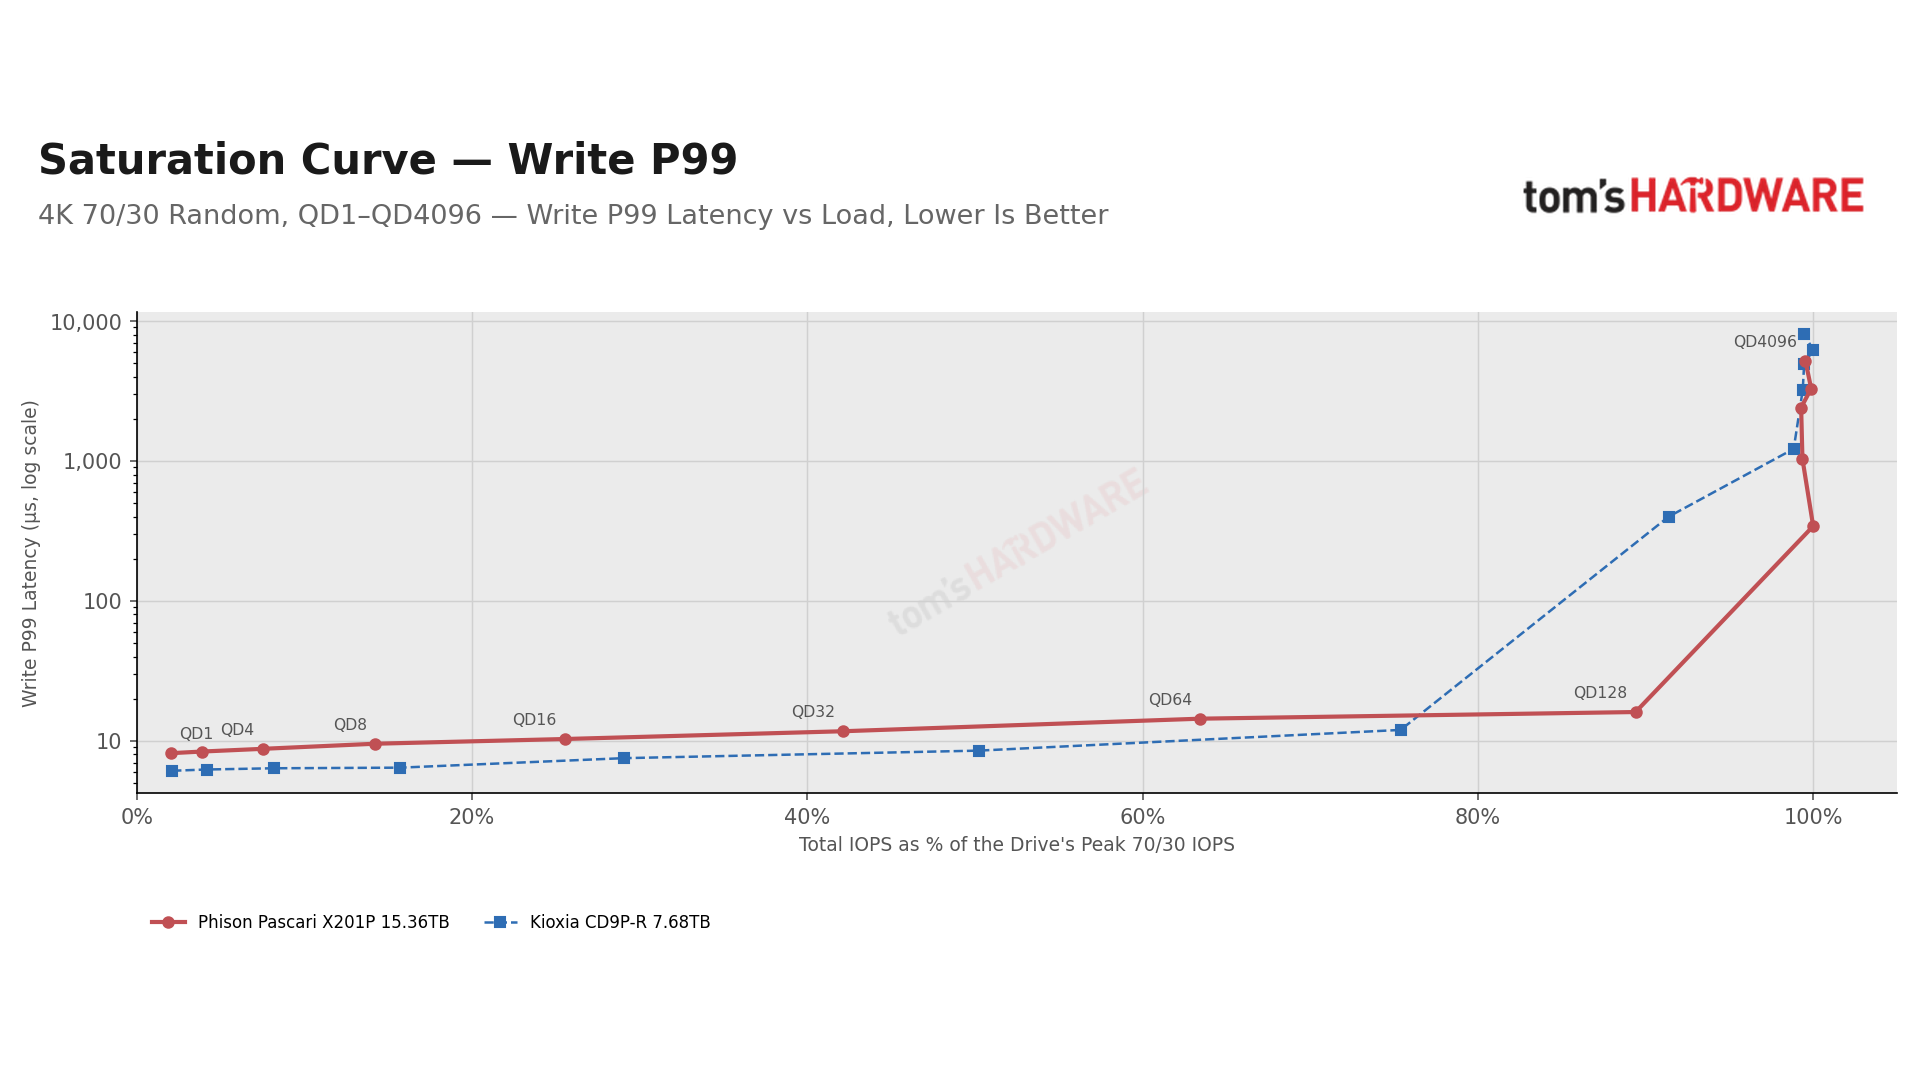
The X201P can be pushed closer to its limit than the CD9P-R before write latency starts to rocket. At 89% of its peak 70/30 load, or 1.12 million IOPS, its write P99 is still just 16 µs. The last step to 100% costs a lot, with a jump to 342 µs for just 12% more IOPS. Past that point, throughput holds at its peak through QD4096 while latency keeps climbing.
The CD9P-R hits a similar wall but earlier, between 75% and 91% of its peak. That puts its practical ceiling near 880K IOPS, against 1.12 million for the X201P. Read latency climbs steadily on both drives with no sharp incline, but at a light load the CD9P-R has the lower read P99. The X201P has the quicker reads from QD8 and up. Near 1.1 million IOPS, at QD128, the X201P’s write P99 is 16 µs, whereas the CD9P-R’s is 399 µs.
Sustained Writes — Hour-Long Random Write
A drive at steady state should deliver the same write speed minute after minute, but garbage collection doesn't always keep pace. When it falls behind, performance can dip or swing into a sawtooth-like pattern as the drive scrambles to free up space. We run 4K random writes at QD256 for an hour on a drive that's already at steady state, logging the result every 10 seconds. A flat line means consistent service; dips and swings mean applications on the drive would see their write speed come and go.
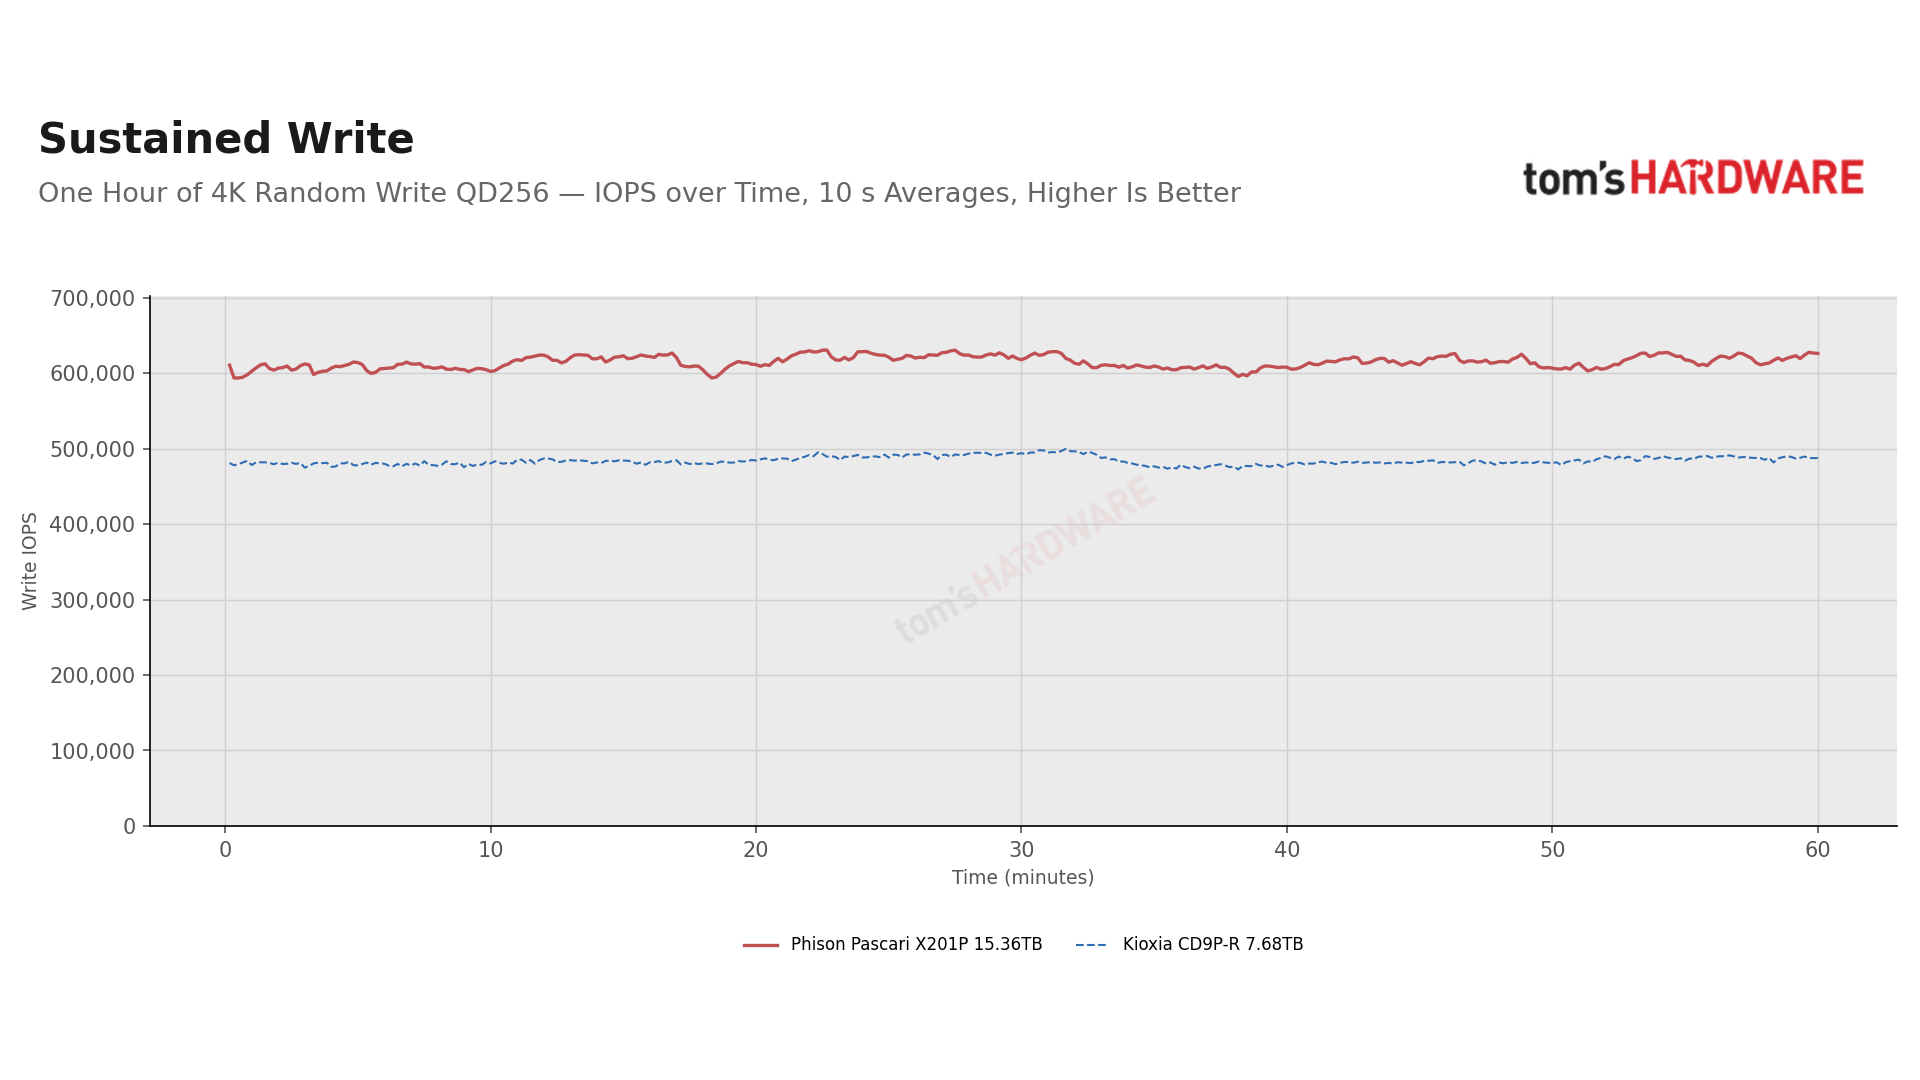
The X201P managed to hold its 615K IOPS for the full hour, which is 2.4% over its 600K rating and 27% more than the CD9P-R. Its line is flat with no sawtooth pattern or drop-offs. The CD9P-R is also very flat, but the X201P is better with write latency at this load: its P99 is 428 µs against the CD9P-R’s 1,204 µs, a big difference. The CD9P-R does keep the lower median, at 383 µs to 416 µs. The X201P’s write rate matched every other steady-state measurement in the run within 1.4%, once the QD32 point was re-measured. For capacity planning, that’s a dependable 610K IOPS, or about 2.5 GB/s.
Write Recovery — Write-to-Read Recovery
Heavy writes can leave a drive with cleanup to finish in the background, and reads that arrive in the meantime may have to wait their turn. We hit the drive with two minutes of 4K random writes at QD256 after a thirty-second ramp, then immediately time QD1 random reads over the next four minutes in a series of short slices. The chart plots read performance against the time since the writes stopped, with a dotted line marking the drive's normal QD1 read rate. A drive that's still busy will read slower before climbing back, and the depth and length of that dip are the result. A line that sits on the baseline means the writes left no lasting effect.
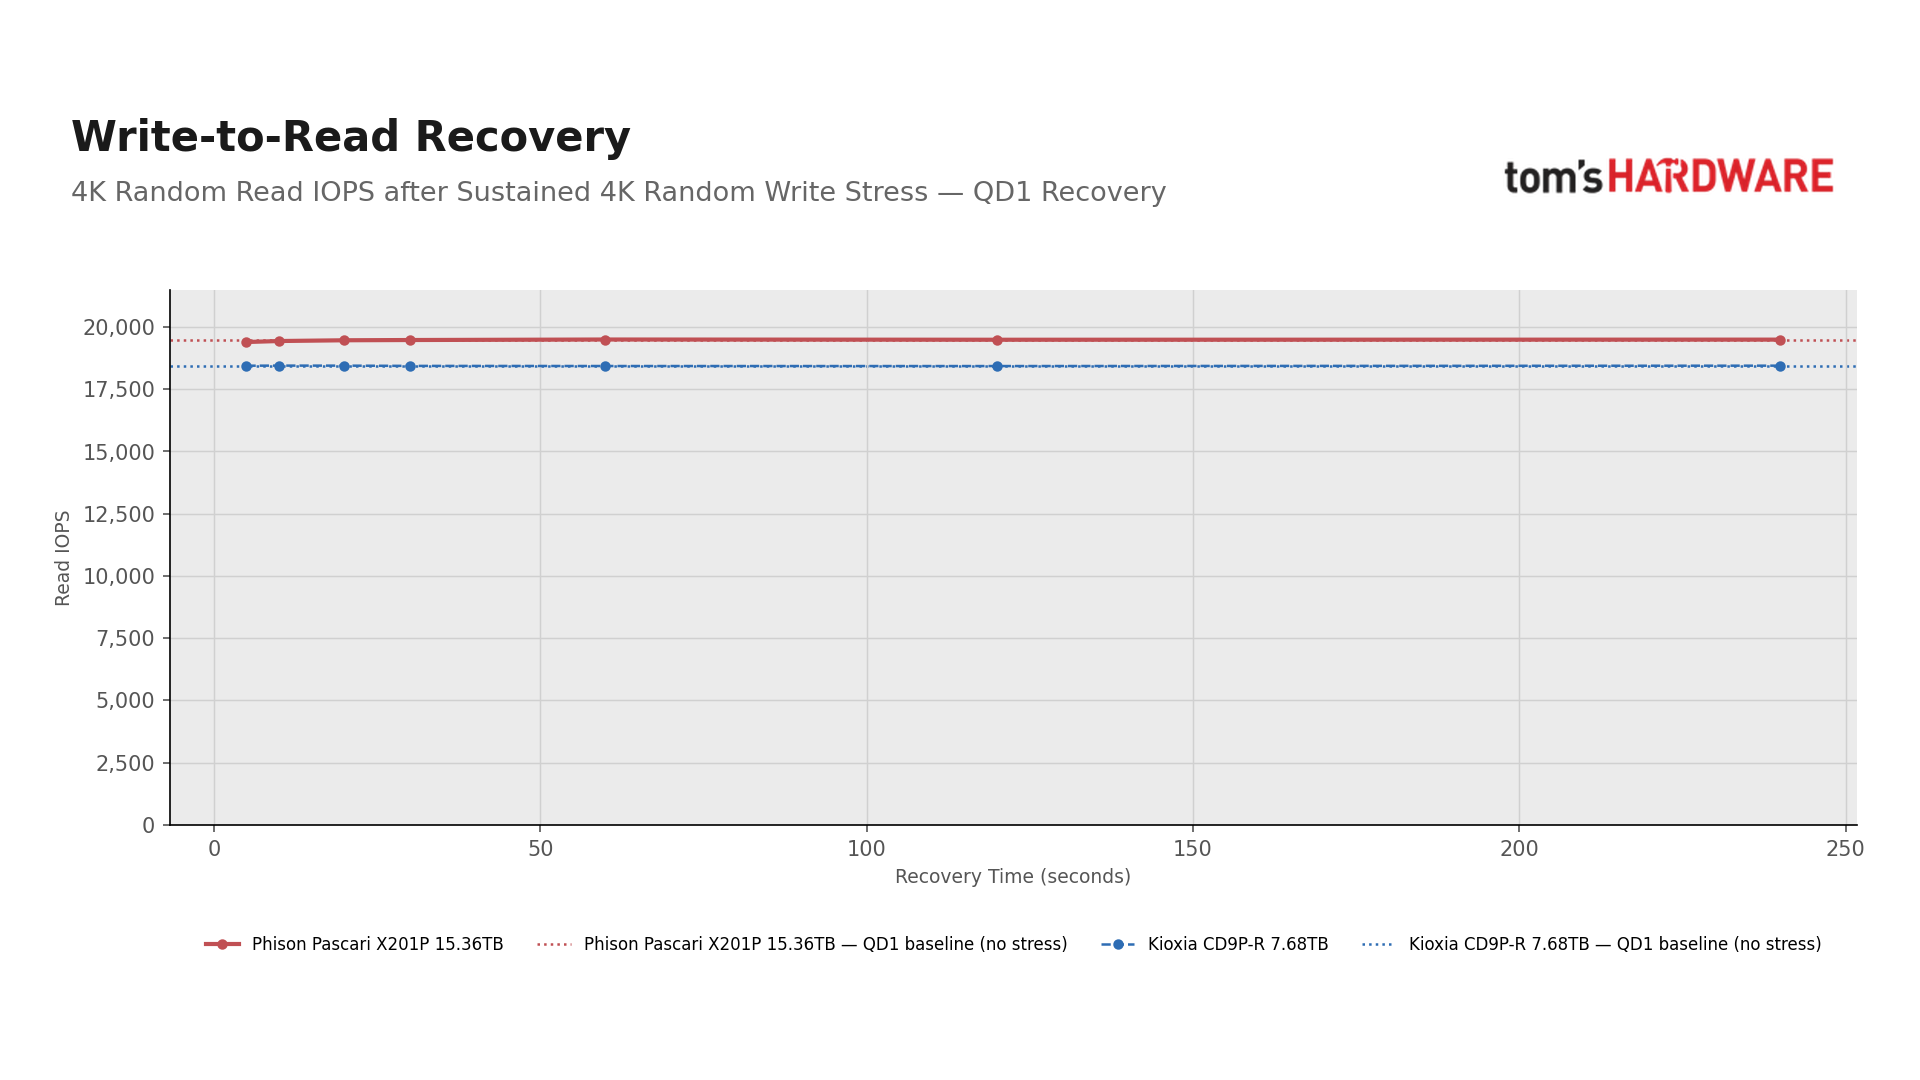
Heavy writes don’t slow the X201P’s follow-up reads. Read speed in the first five seconds after the writes stop is within half a percent of normal, so there is no dip on the chart. In the numbers behind the chart, there is a short-lived tail: for the first ten seconds, about one read in 10,000 (P99.99) takes 210 µs, where normally it takes 60 µs. At this read rate, that’s roughly two reads a second. It is back to normal by the 20-second mark. The deepest tail we measure, P99.999, takes about a minute to settle. The CD9P-R showed nothing of the kind.
Write Recovery — Idle Recovery
Real servers have quiet moments, and a drive can use them to clean up and free space for the next burst of writes. Idle recovery measures what that downtime buys back. After a minute of sustained 4K random writes, the drive sits idle for anywhere from zero to five minutes, then takes a 10-second burst of writes at QD256. We log each burst second by second so even a brief speedup reveals itself. The chart compares each burst with the drive's write speed under constant load: a line that rises with longer gaps means the drive puts idle time to work, while a flat line means it gains nothing from the break.
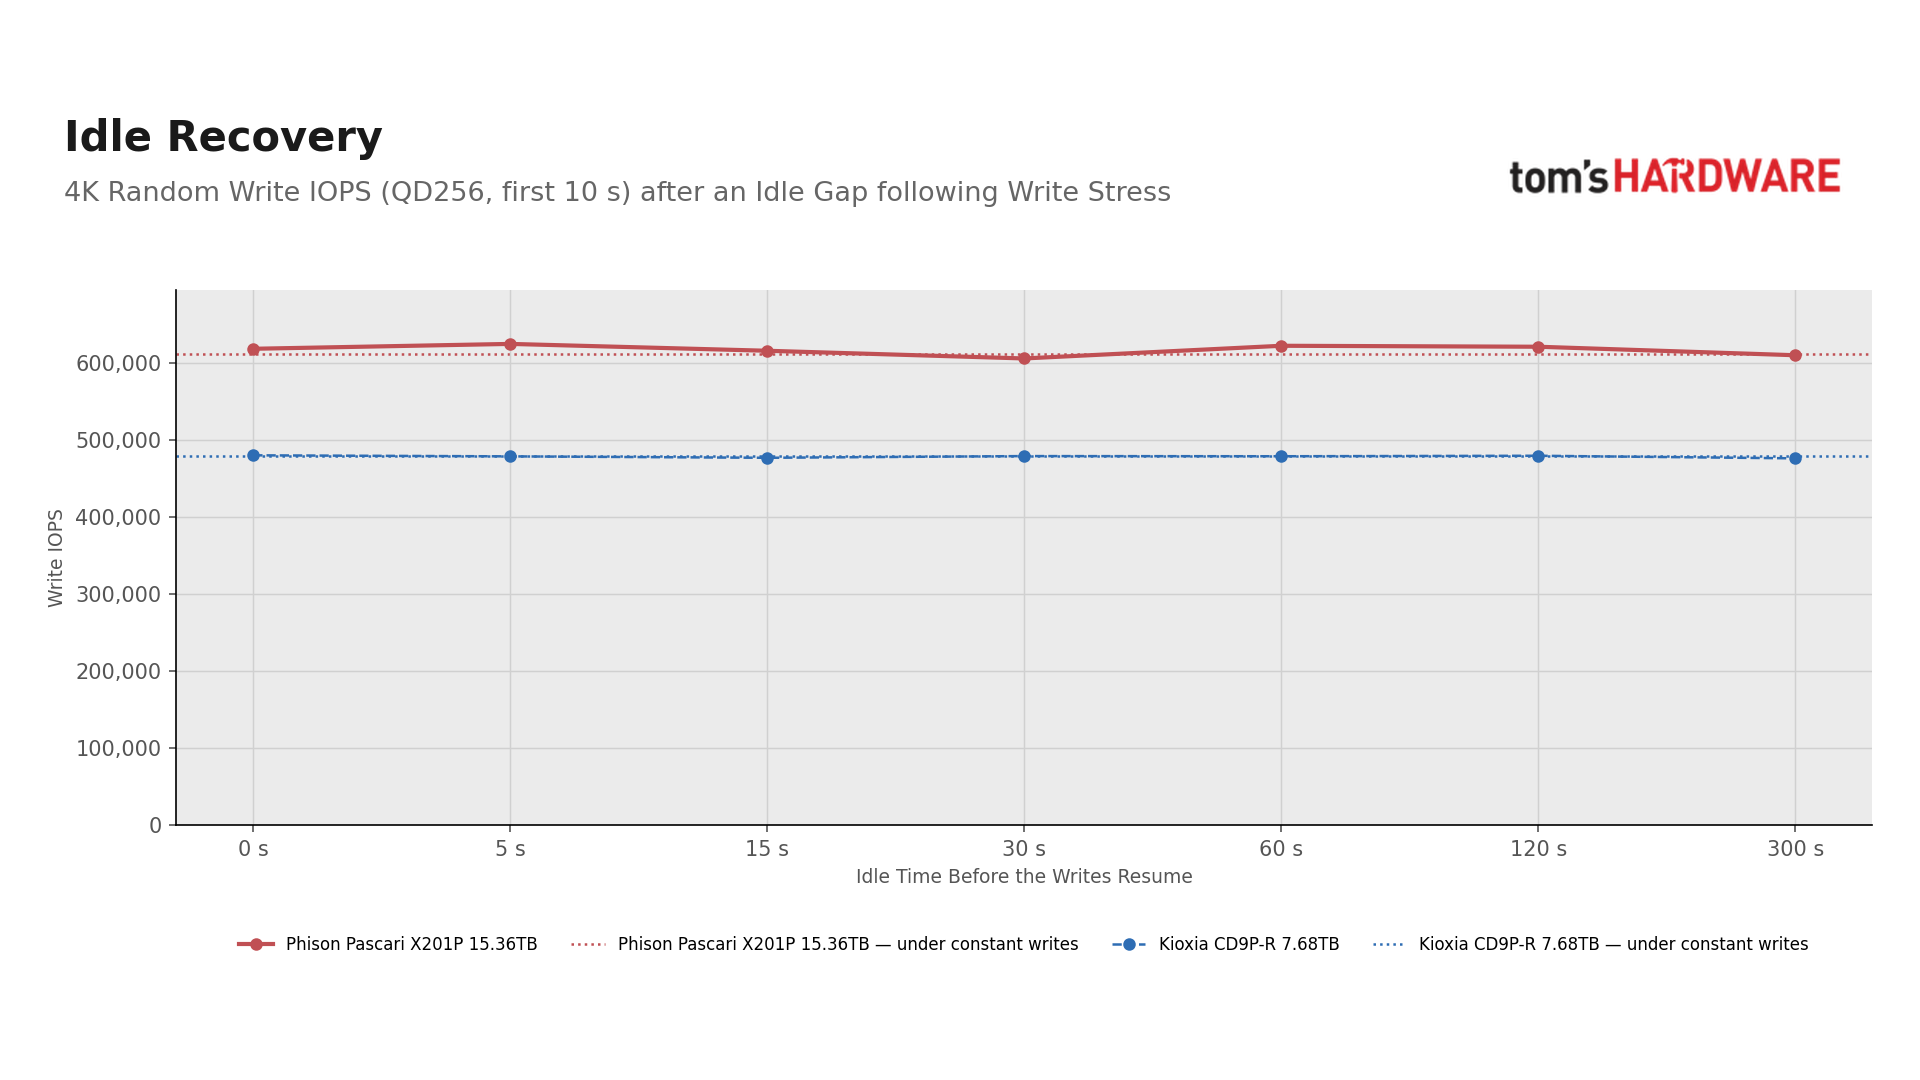
Idle time doesn’t buy the X201P anything substantial. Over a 10-second burst, its write rate after a five-minute rest is the same as after no rest at all, within about 2% of its constant rate either way. It does have a one-second spike at the beginning of each burst, which is 6 to 20% above that constant rate. It doesn’t show on the chart, which plots 10-second averages. The spike is there even with zero idle time, so it’s not the drive using the time to clean up. The CD9P-R is flat in both cases.
Database Workloads — Simulated I/O Patterns
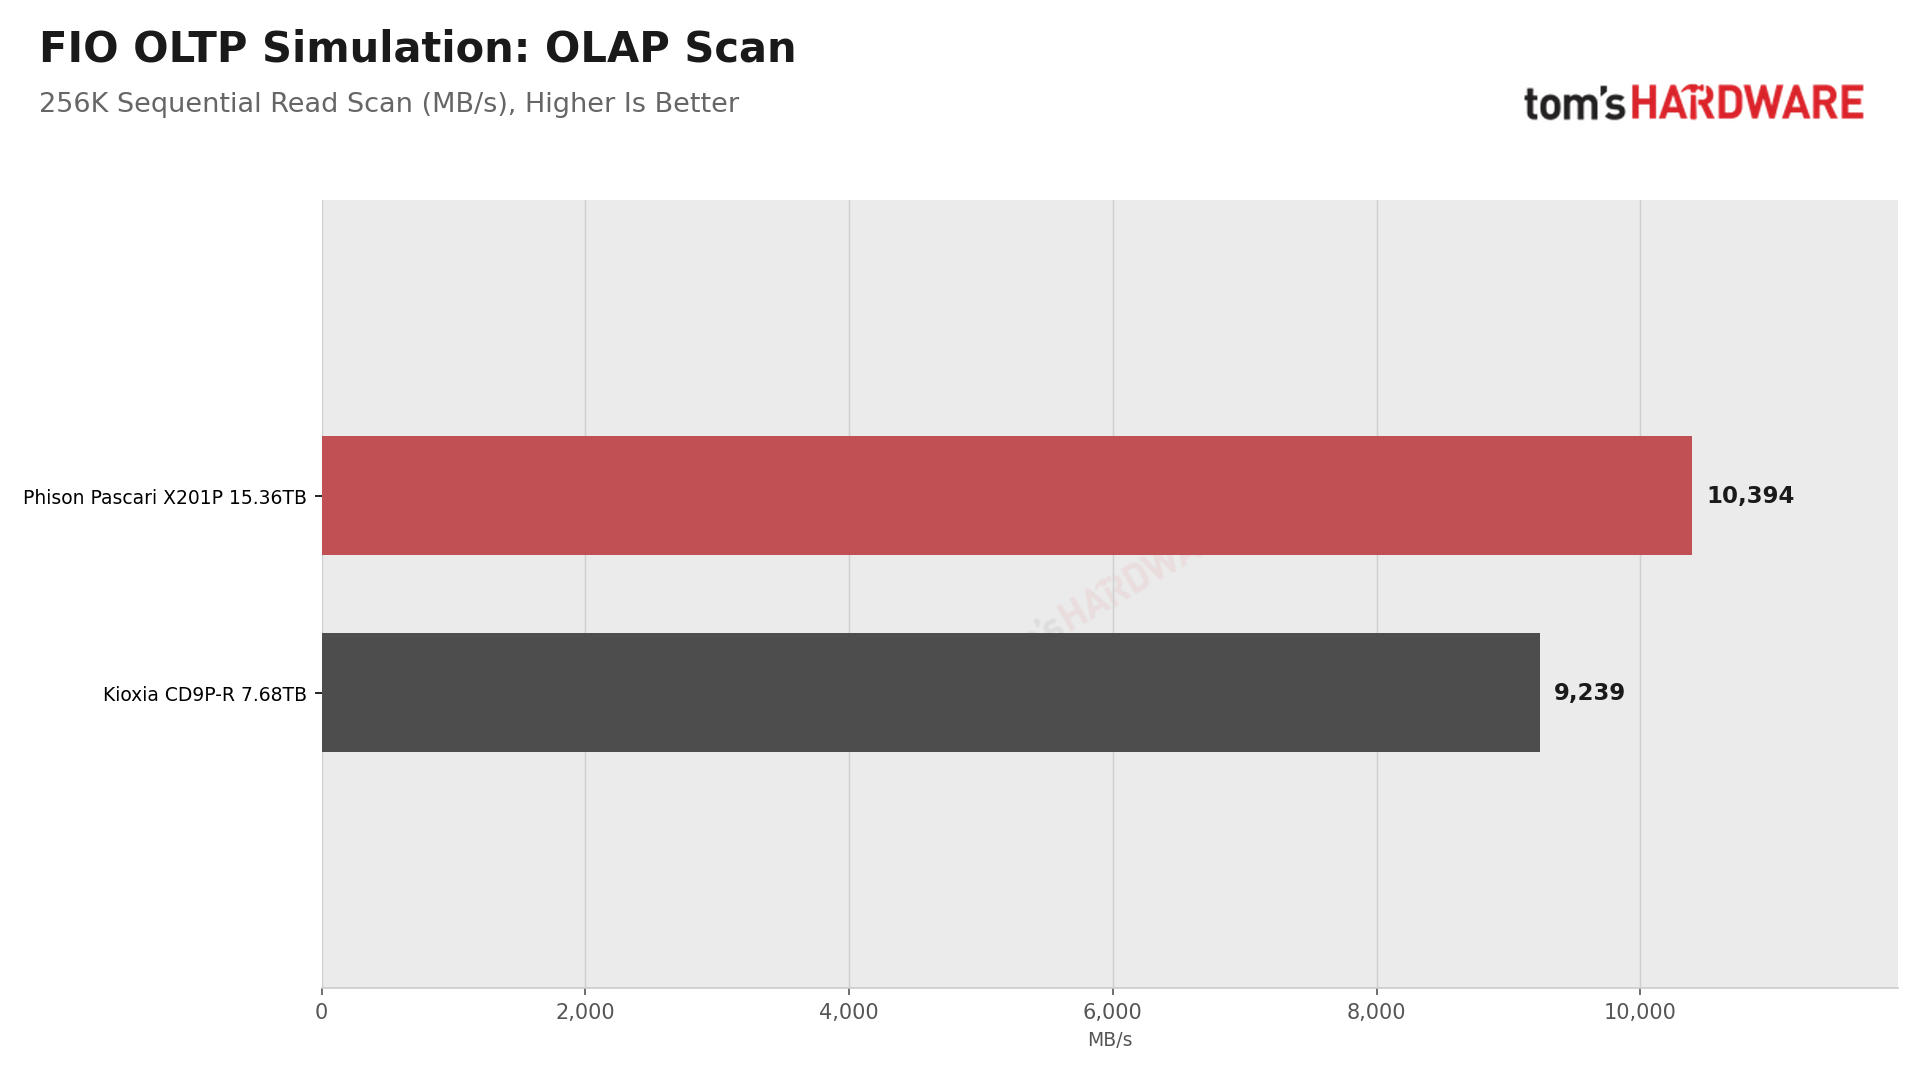
Databases lean on storage in three distinct ways: committing transactions to a log, reading and writing pages of data, and scanning large tables for analytics. We simulate each pattern with fio rather than running a real database, so the results reflect the drive rather than how much data the database can cache in memory. Log commits are 4K sequential writes at QD1, each followed by a sync, which is how databases typically make a transaction durable. Page I/O is an 8K random mix of 70% reads and 30% writes at QD16, and the analytics scan is 256K sequential reads at QD8. For commits, we report both latency and commits per second.
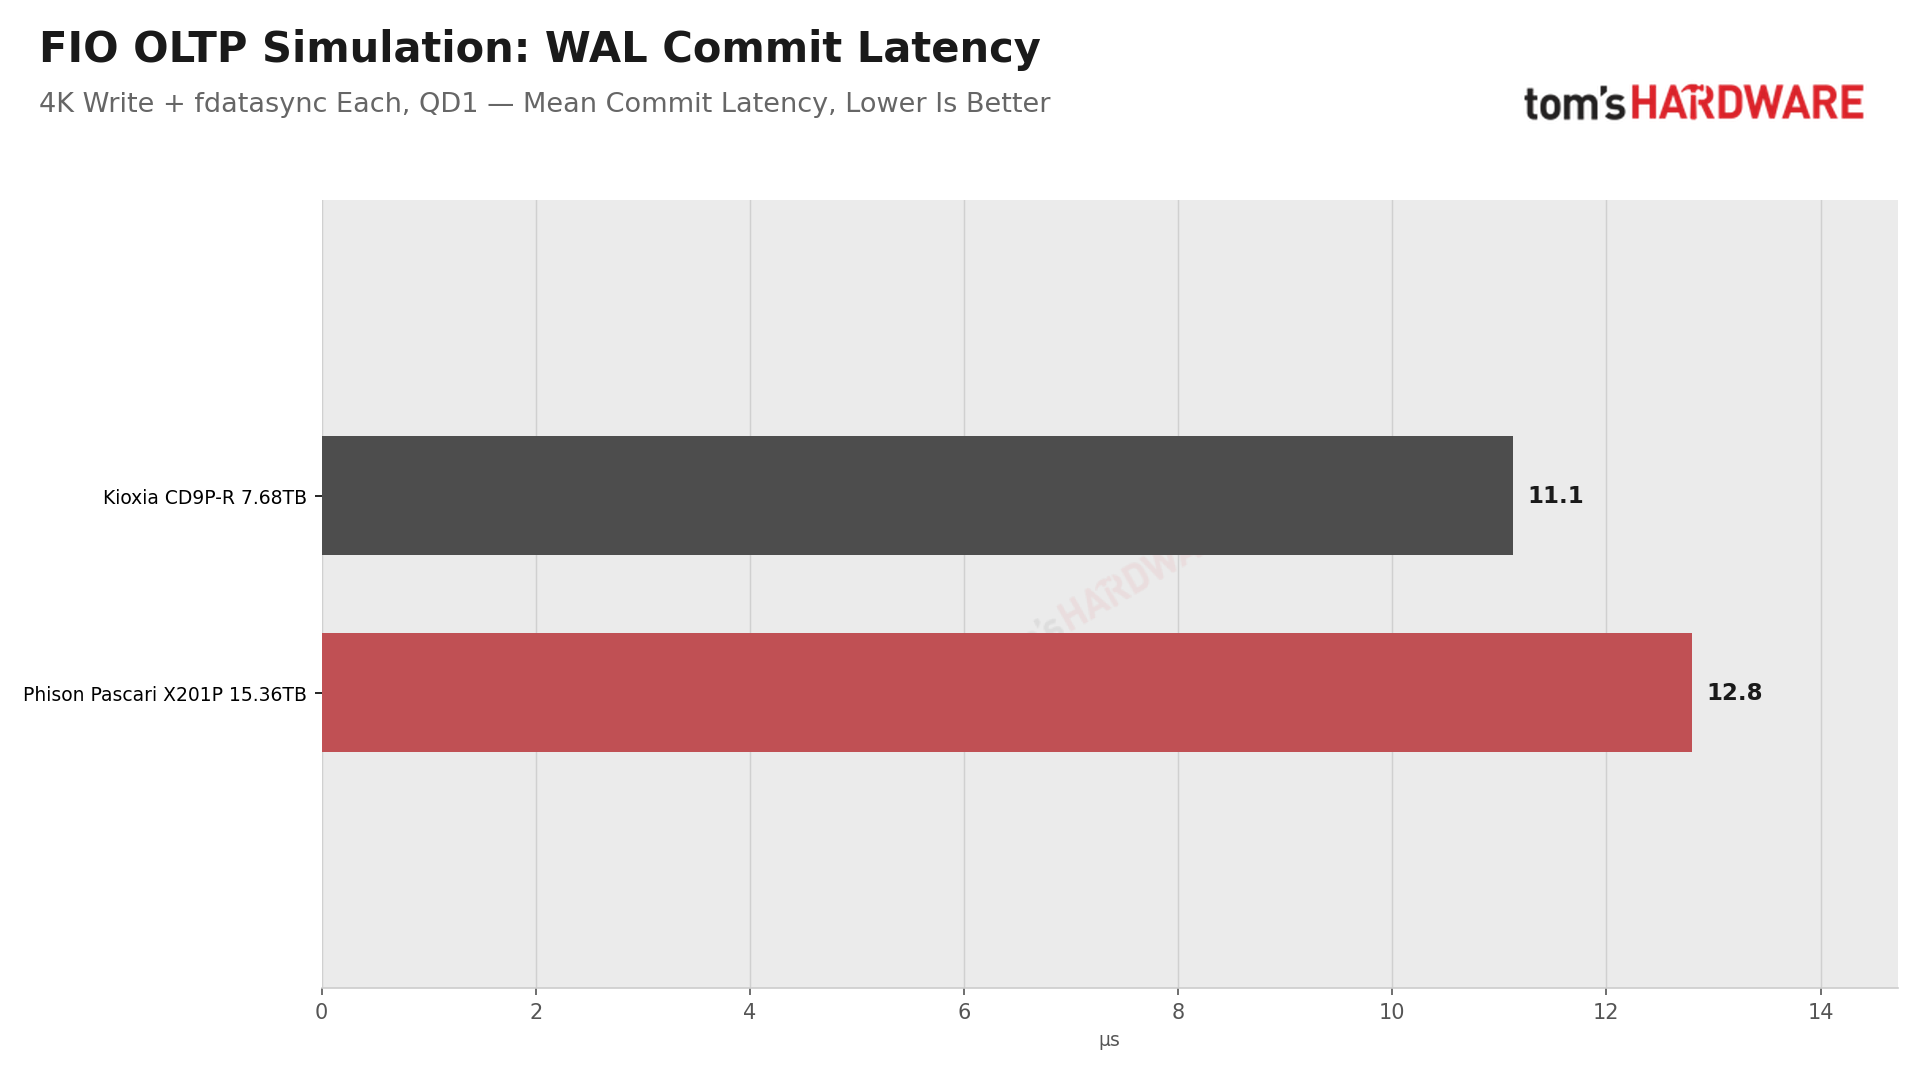
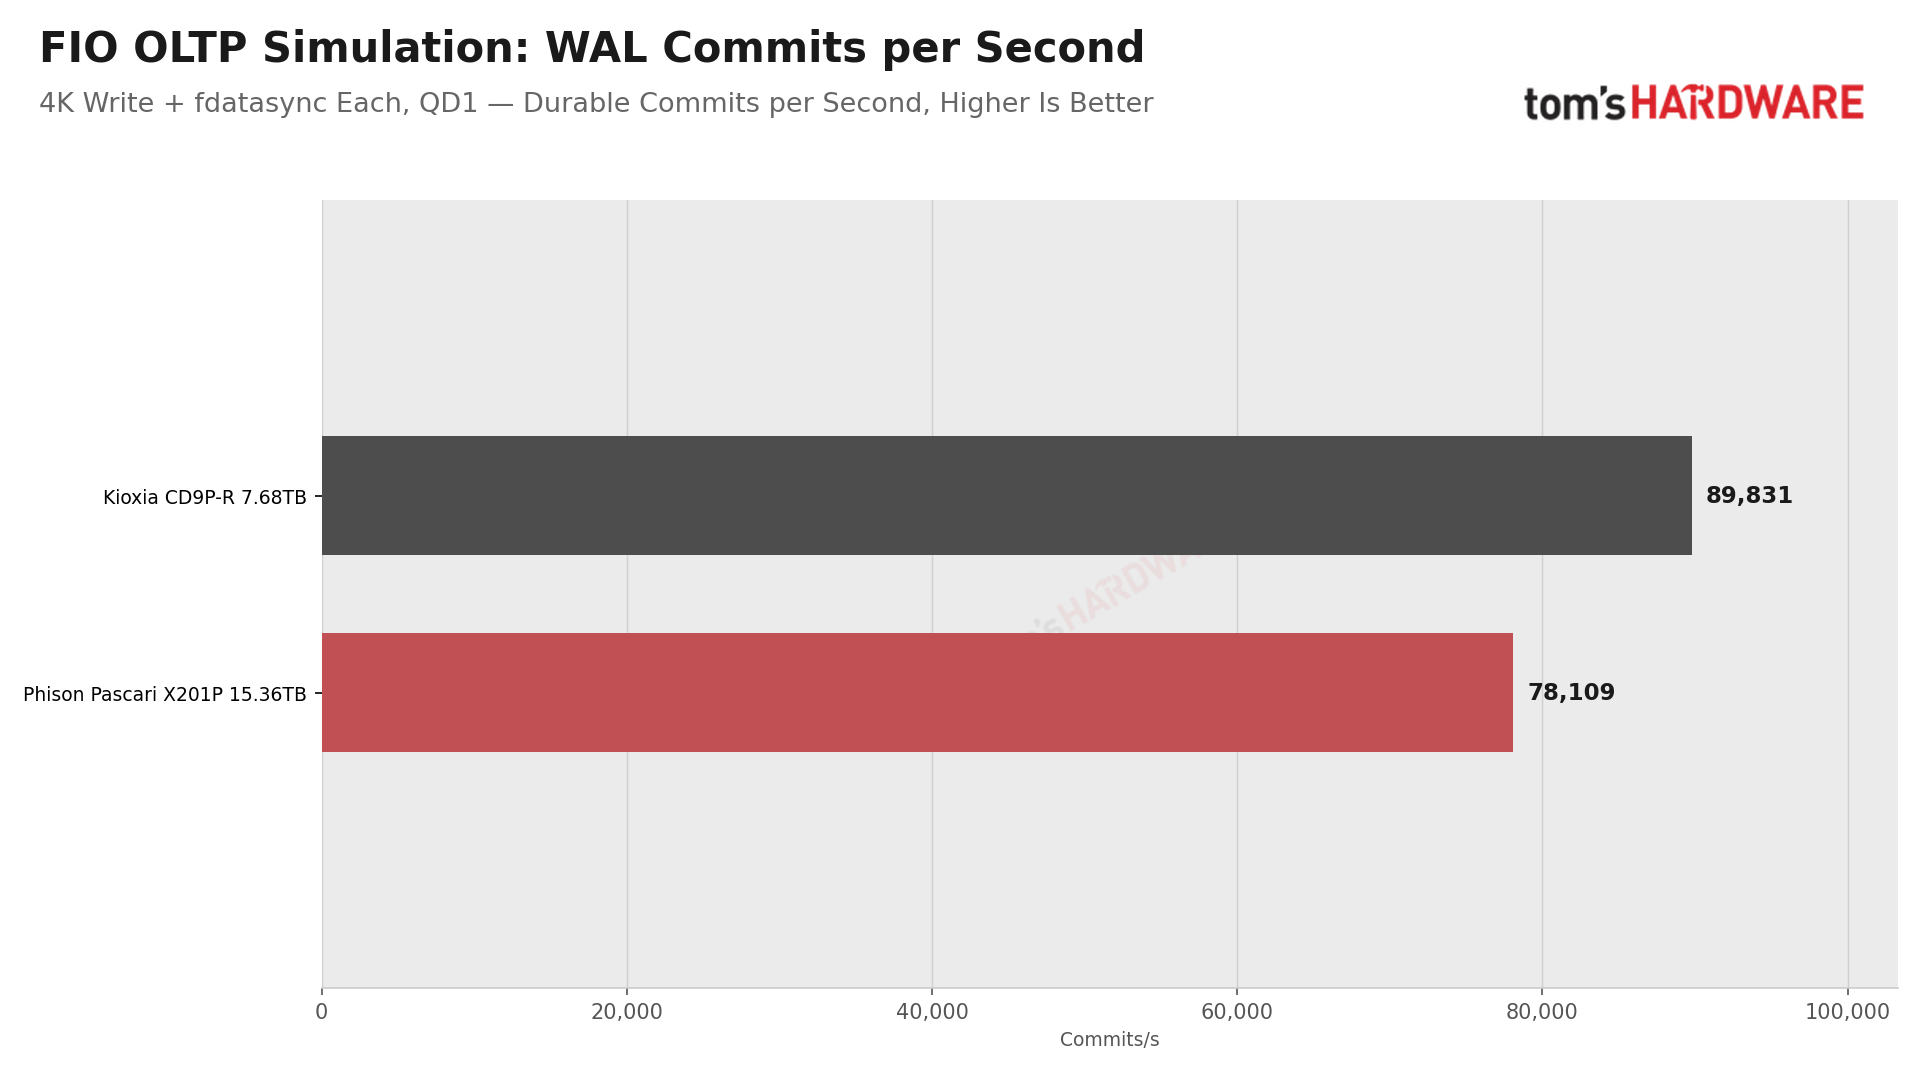
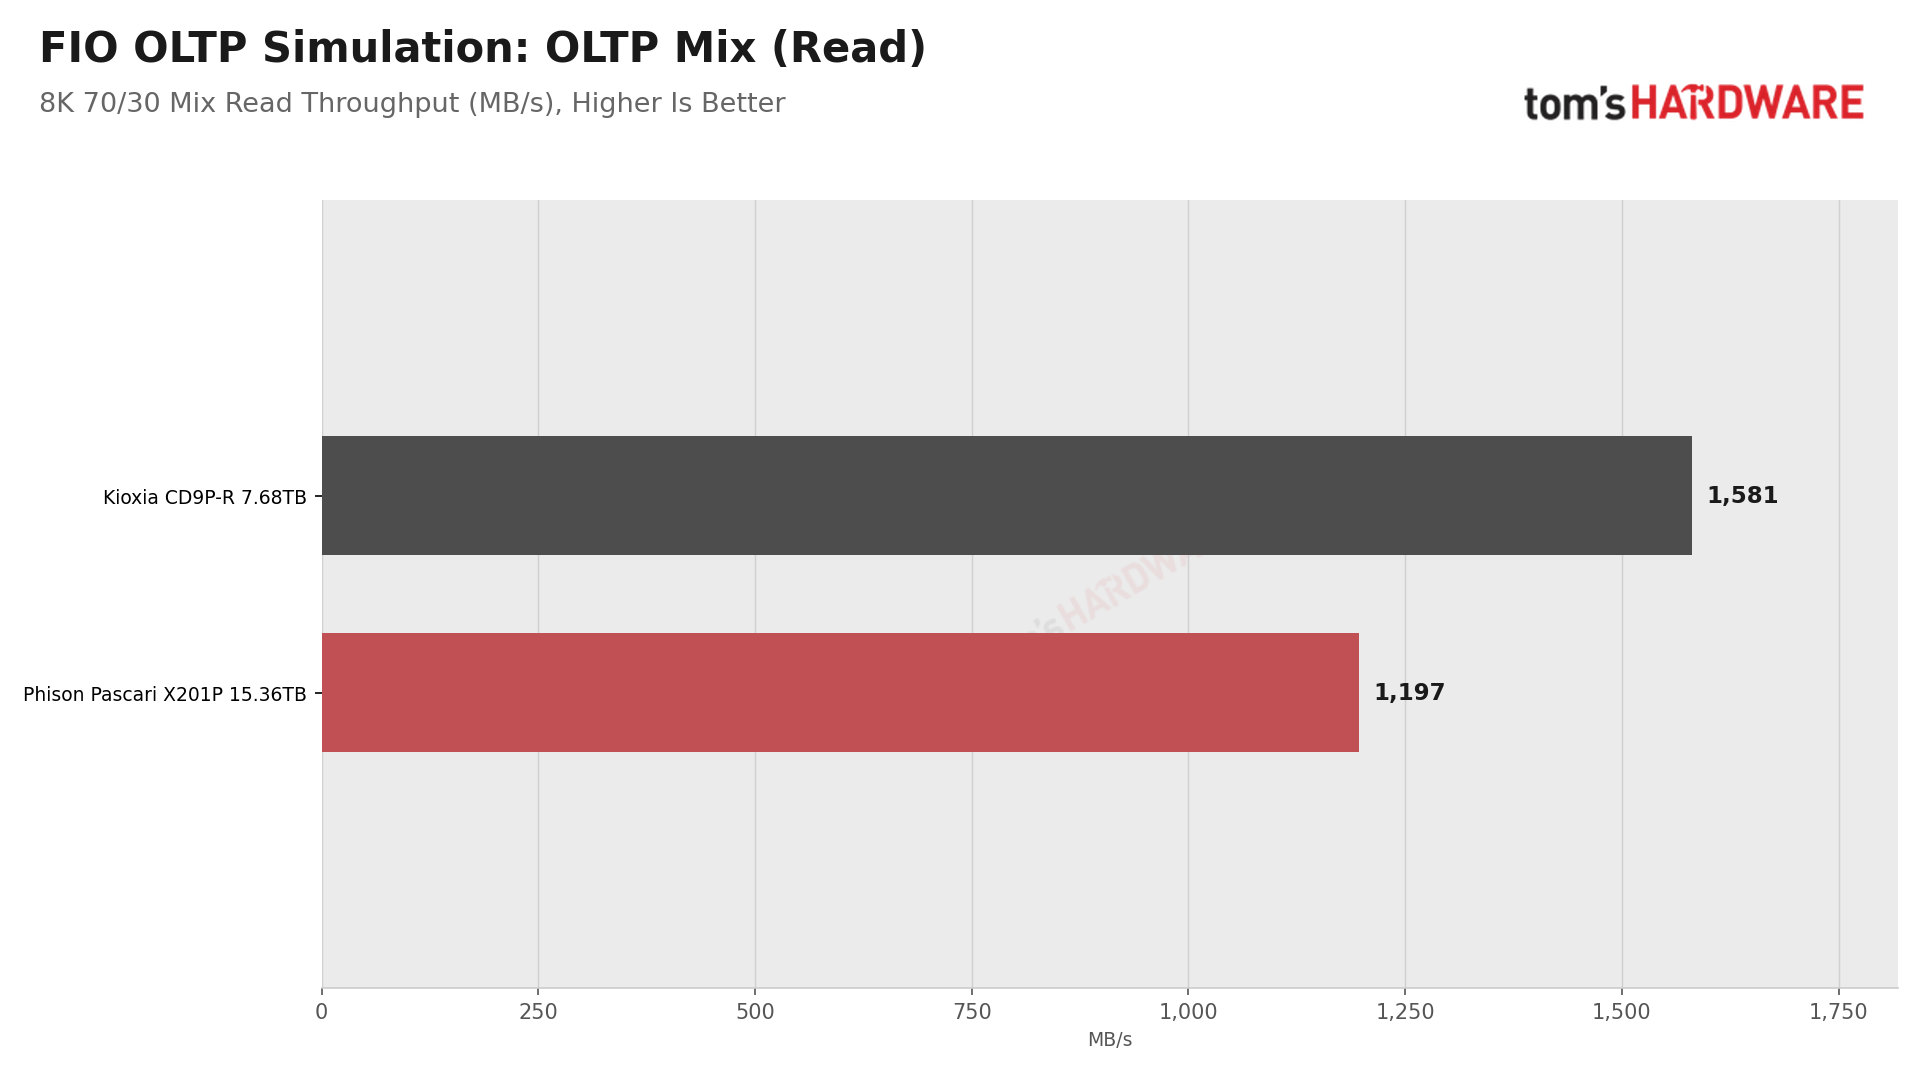
Phison does market the X201P at databases, but this section is where it does least well against the CD9P-R, losing two of the three patterns. Log commits are QD1 writes, where the CD9P-R is the quicker drive, with the X201P only managing 78K commits per second versus the Kioxia drive’s 90K. The 8K page mix runs at QD16, which falls on the X201P’s 8K weak spot, coming in at 209K versus 276K IOPS.
Two things do go the X201P’s way. Its reads in that mix are the more predictable, with a P99 of 322 µs versus 428 µs, and it wins the analytics scan by 12.5%, at 10.4 versus 9.2 GB/s. This stays in line with its bandwidth advantage in most other tests.
In totality, this should not be read as a complete verdict on database performance, as these are moderate-load tests. In the same 8K 70/30 mix at QD128 and above, the X201P is the faster drive. For transactional work at moderate load, the CD9P-R is the better of the two; for scan-heavy analytics and heavily loaded mixes, it’s the X201P.
AI Storage — Checkpoint Save and Restore
Training an AI model means saving its state to storage at regular intervals, so a crash doesn't cost days of progress. In large training jobs, each rank, often one per GPU, writes its own slice of the checkpoint at the same time, and training waits until the slowest one finishes.
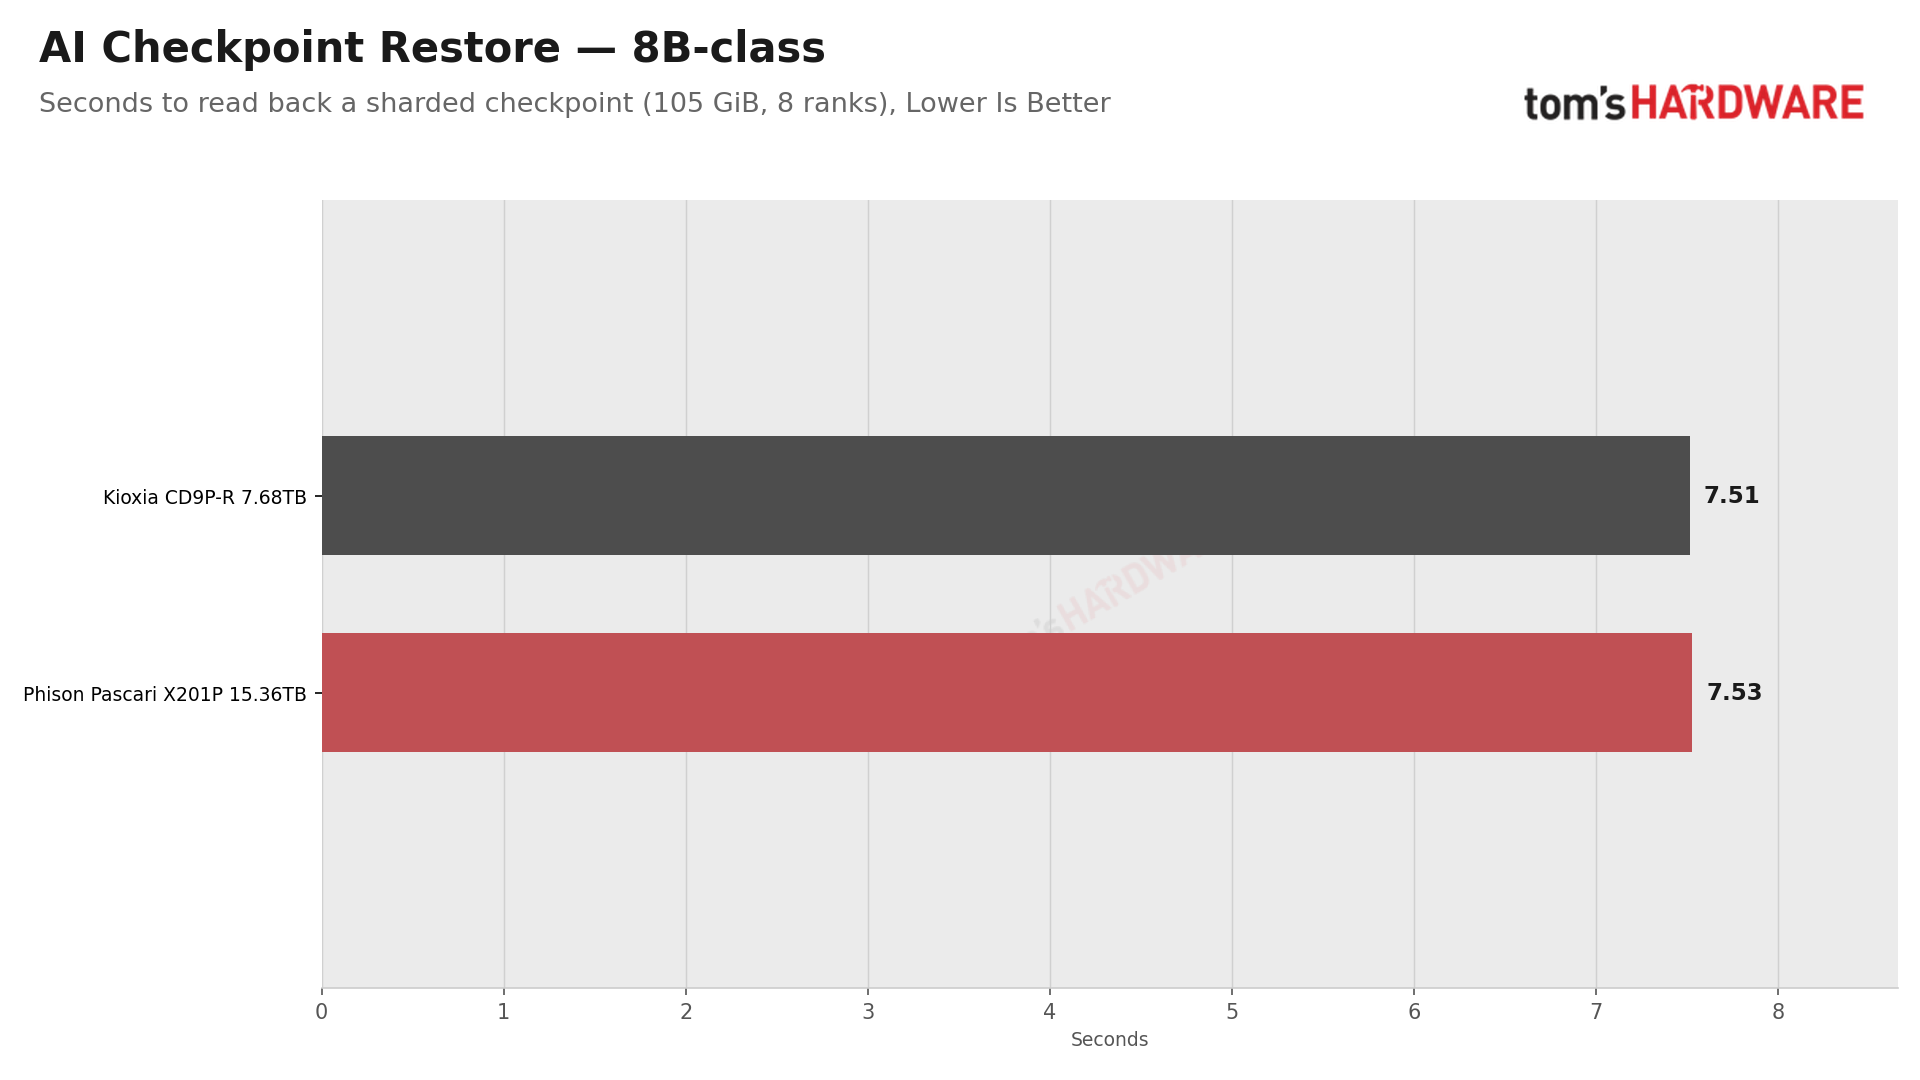
We model checkpoints for two model sizes: an 8B-class model, with 105GiB split across eight writers, and a 70B-class model, with 912GiB across 64. Each writer saves its share in 1MB transfers, and we then read everything back to simulate a restore. fio stands in for the GPUs, and the result is the time until the last writer finishes, which is when a real checkpoint would be done.
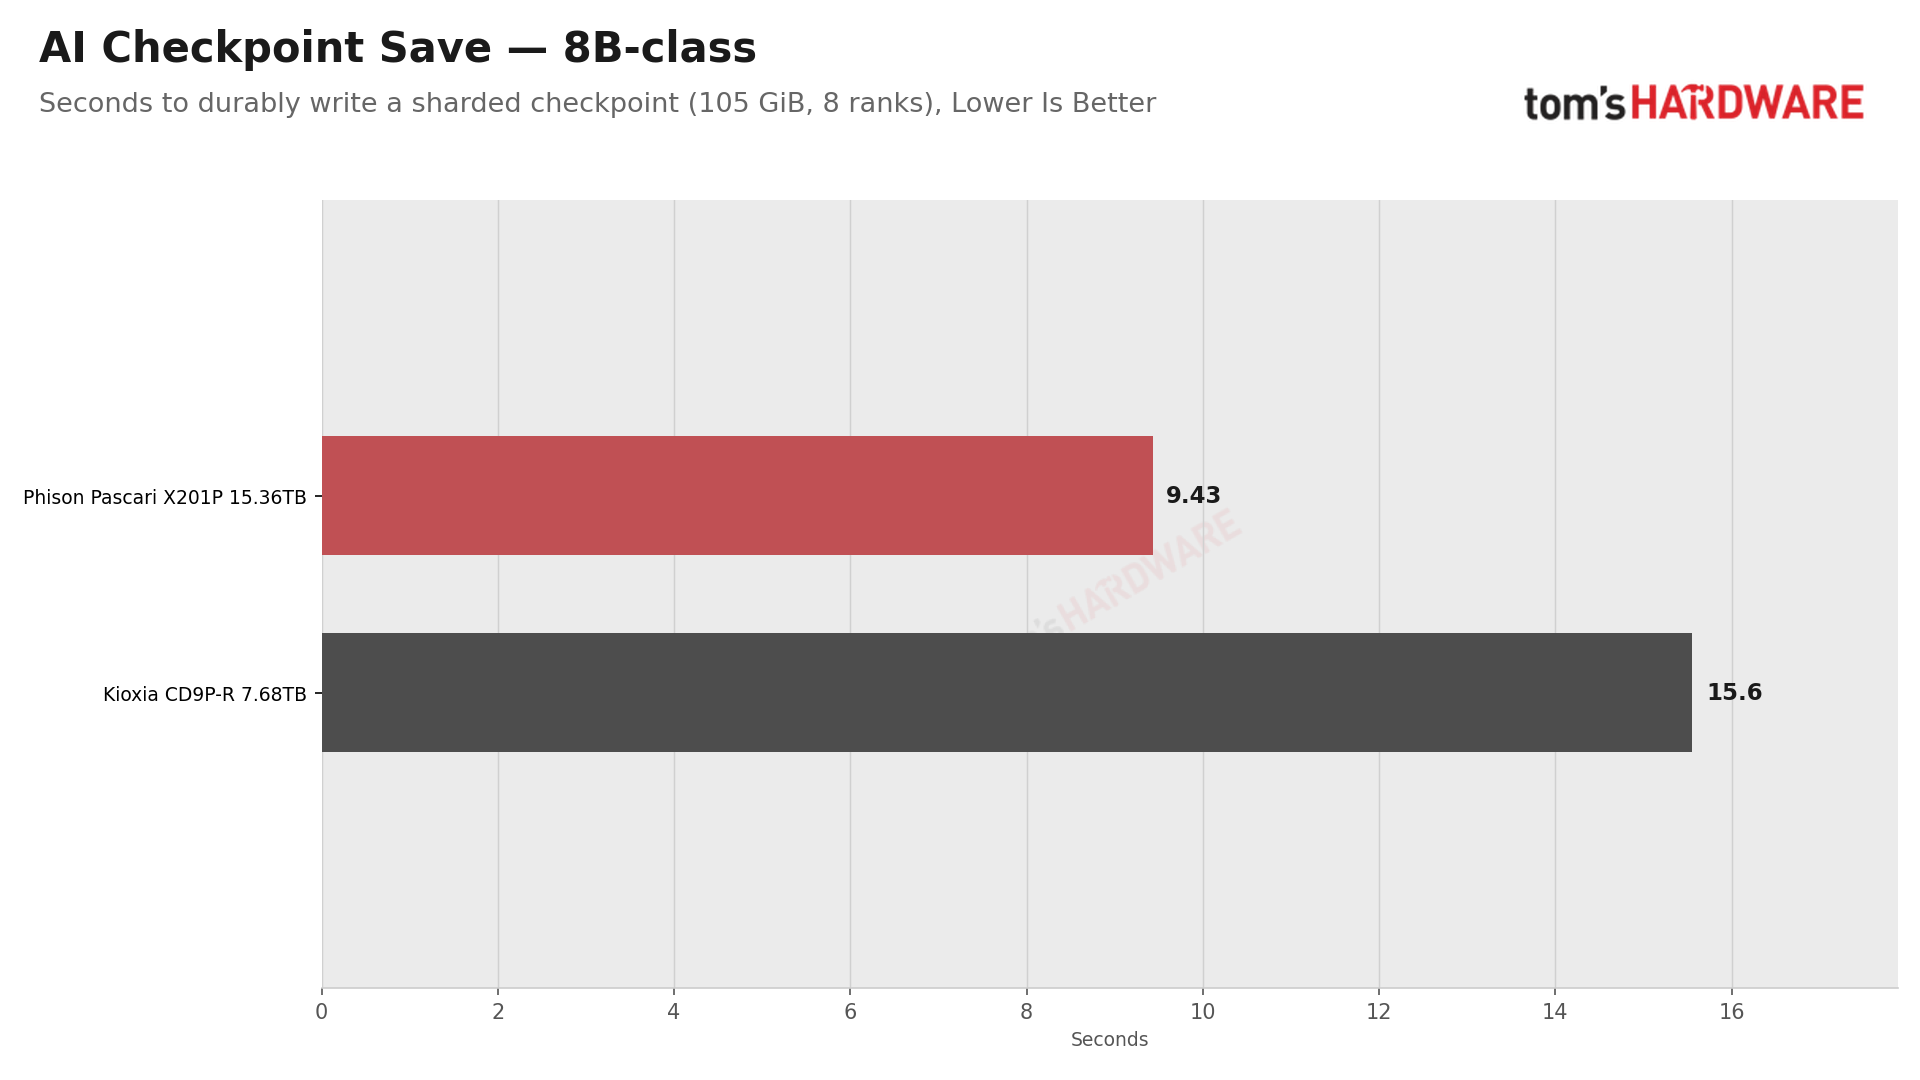
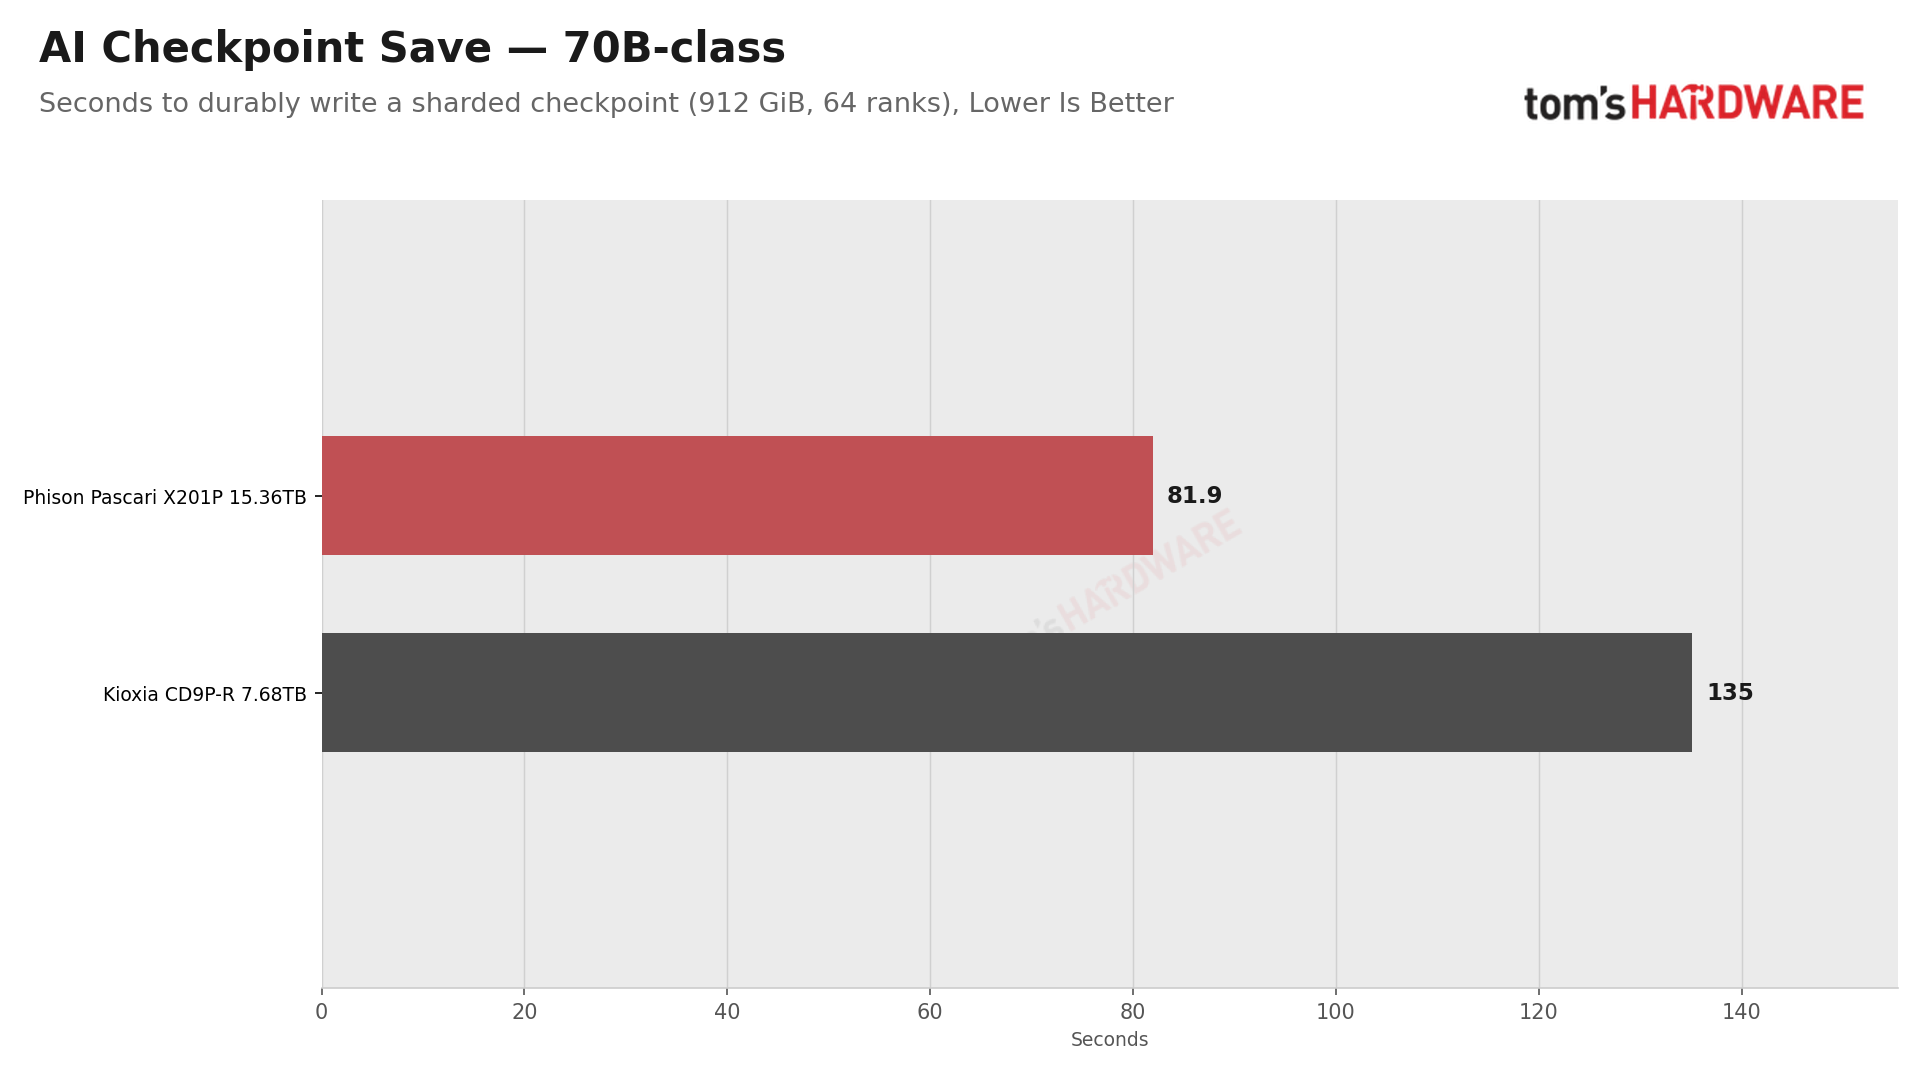
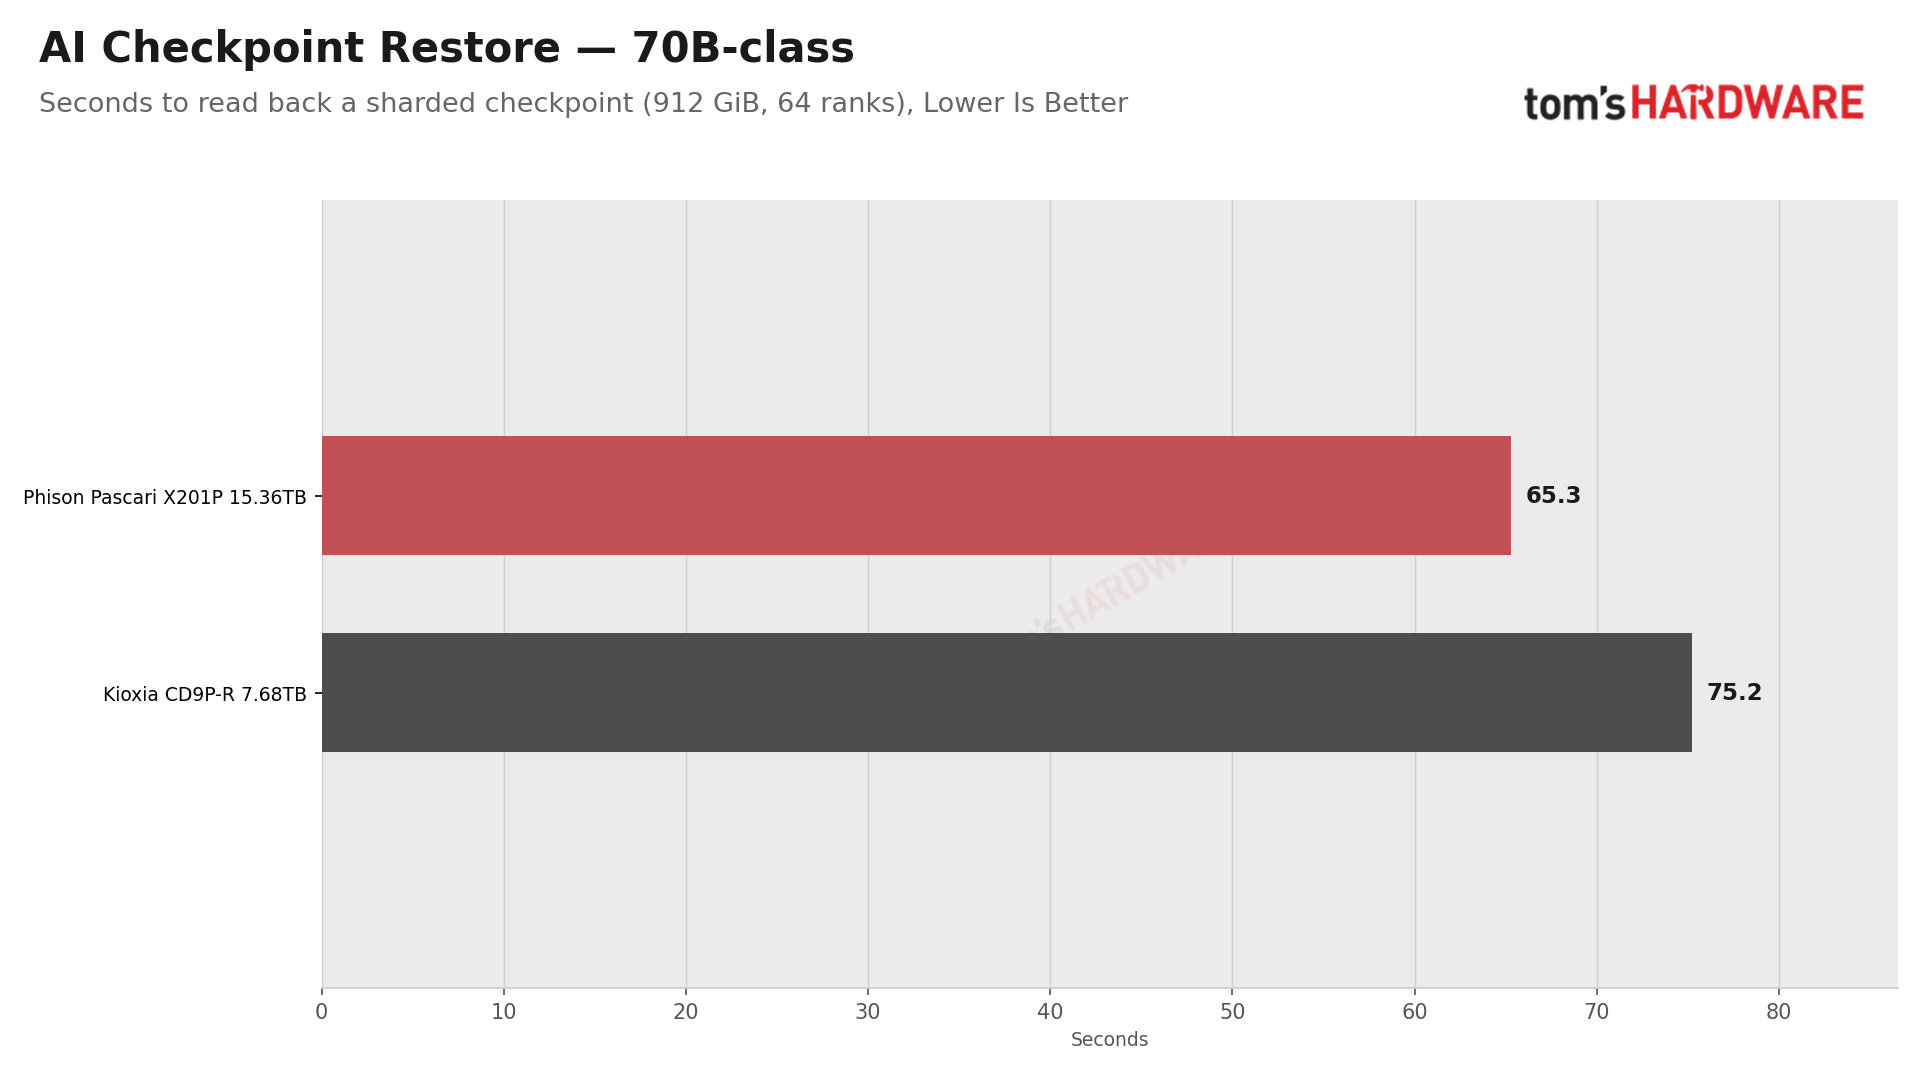
This is where the X201P hits best, at least in terms of practical results, but that’s also expected as it follows directly from its excellent sequential write speed. A checkpoint save is a pure write-bandwidth job, and both sizes run at the drive’s 12 GB/s, finishing in 39% less time than on the CD9P-R. This comes out to 9.4 versus 15.6 seconds for the smaller, 8B-class model, and 82 seconds versus 135 for the 70B-class.
Restores are reads, so the small one ties at the link limit, or 7.5 seconds each. The larger restore, on the other hand, takes 13% less time on the X201P, at 65 versus 75 seconds. That links back to the sequential sweep, as the larger restore keeps 512 1MB reads in flight, a depth where the X201P holds full speed and the CD9P-R does not. In a training cluster that checkpoints often, save time is the more important number, and it works in the X201P’s favor.
Our only aside here is that the gap might be less pronounced with the smaller, 7.68TB X201P, which Phison rates at 9,200 MB/s for sequential writes. That is still above Kioxia’s 7,000 MB/s rating for the CD9P-R.
AI Storage — Checkpoint Interference
A checkpoint rarely has a drive only to itself. The same storage may be serving inference requests, database queries, or other jobs while a save is underway, and those re...


