In this tutorial, you’ll be equipped to make production-quality, presentation-ready Python histogram plots with a range of choices and features.
If you have introductory to intermediate knowledge in Python and statistics, then you can use this article as a one-stop shop for building and plotting histograms in Python using libraries from its scientific stack, including NumPy, Matplotlib, pandas, and Seaborn.
A histogram is a great tool for quickly assessing a probability distribution that is intuitively understood by almost any audience. Python offers a handful of different options for building and plotting histograms. Most people know a histogram by its graphical representation, which is similar to a bar graph:
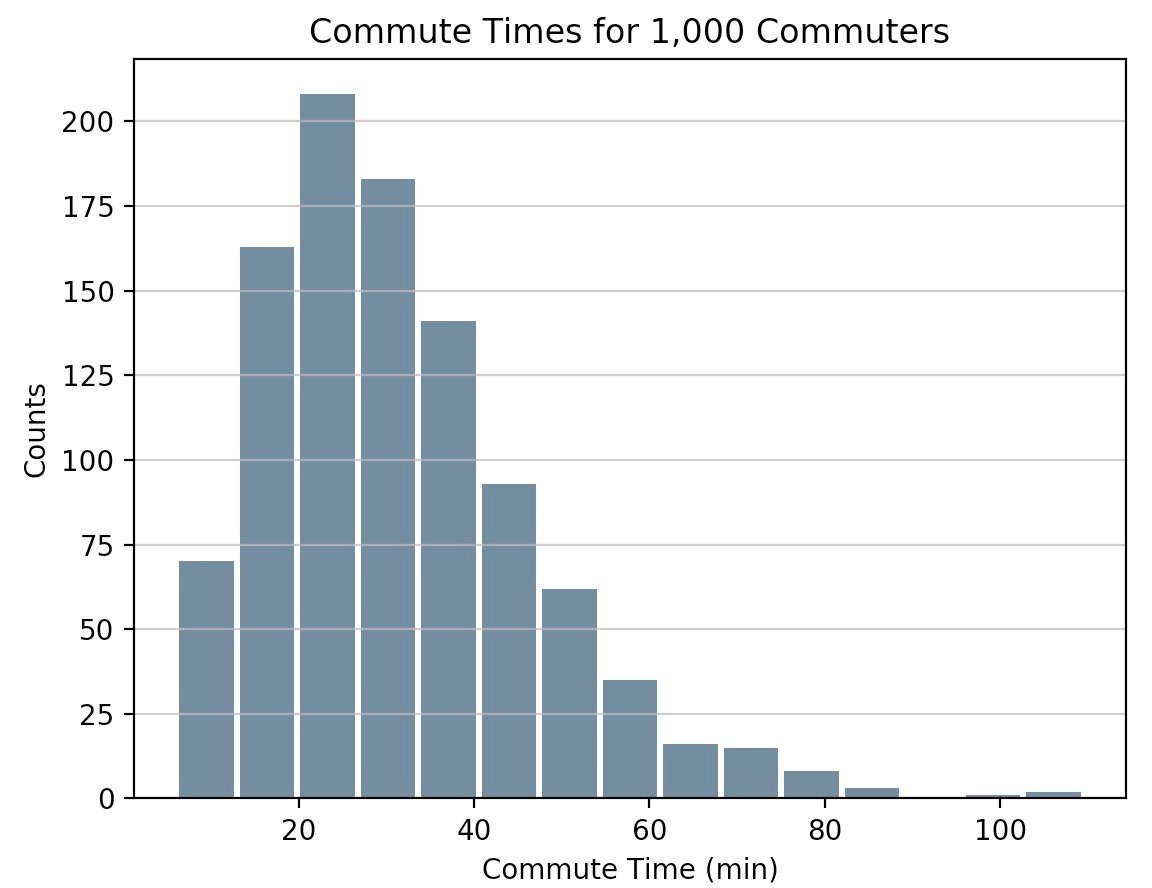
This article will guide you through creating plots like the one above as well as more complex ones. Here’s what you’ll cover:
- Building histograms in pure Python, without use of third party libraries
- Constructing histograms with NumPy to summarize the underlying data
- Plotting the resulting histogram with Matplotlib, pandas, and Seaborn
Free Bonus: Short on time? Click here to get access to a free two-page Python histograms cheat sheet that summarizes the techniques explained in this tutorial.
Histograms in Pure Python
When you are preparing to plot a histogram, it is simplest to not think in terms of bins but rather to report how many times each value appears (a frequency table). A Python dictionary is well-suited for this task:
>>> # Need not be sorted, necessarily >>> a = (0, 1, 1, 1, 2, 3, 7, 7, 23) >>> def count_elements(seq) -> dict: ... """Tally elements from `seq`.""" ... hist = {} ... for i in seq: ... hist[i] = hist.get(i, 0) + 1 ... return hist >>> counted = count_elements(a) >>> counted {0: 1, 1: 3, 2: 1, 3: 1, 7: 2, 23: 1} count_elements() returns a dictionary with unique elements from the sequence as keys and their frequencies (counts) as values. Within the loop over seq, hist[i] = hist.get(i, 0) + 1 says, “for each element of the sequence, increment its corresponding value in hist by 1.”
In fact, this is precisely what is done by the collections.Counter class from Python’s standard library, which subclasses a Python dictionary and overrides its .update() method:
>>> from collections import Counter >>> recounted = Counter(a) >>> recounted Counter({1: 3, 7: 2, 0: 1, 2: 1, 3: 1, 23: 1}) You can confirm that your handmade function does virtually the same thing as collections.Counter by testing for equality between the two:
>>> recounted.items() == counted.items() True Technical Detail: The mapping from count_elements() above defaults to a more highly optimized C function if it is available. Within the Python function count_elements(), one micro-optimization you could make is to declare get = hist.get before the for loop. This would bind a method to a variable for faster calls within the loop.
It can be helpful to build simplified functions from scratch as a first step to understanding more complex ones. Let’s further reinvent the wheel a bit with an ASCII histogram that takes advantage of Python’s output formatting:
def ascii_histogram(seq) -> None: """A horizontal frequency-table/histogram plot.""" counted = count_elements(seq) for k in sorted(counted): print("{0:5d} {1}".format(k, "+" * counted[k])) This function creates a sorted frequency plot where counts are represented as tallies of plus (+) symbols. Calling sorted() on a dictionary returns a sorted list of its keys, and then you access the corresponding value for each with counted[k]. To see this in action, you can create a slightly larger dataset with Python’s random module:
>>> # No NumPy ... yet >>> import random >>> random.seed(1) >>> vals = [1, 3, 4, 6, 8, 9, 10] >>> # Each number in `vals` will occur between 5 and 15 times. >>> freq = (random.randint(5, 15) for _ in vals) >>> data = [] >>> for f, v in zip(freq, vals): ... data.extend([v] * f) >>> ascii_histogram(data) 1 +++++++ 3 ++++++++++++++ 4 ++++++ 6 +++++++++ 8 ++++++ 9 ++++++++++++ 10 ++++++++++++ Here, you’re simulating plucking from vals with frequencies given by freq (a generator expression). The resulting sample data repeats each value from vals a certain number of times between 5 and 15.
Read the full article at https://realpython.com/python-histograms/ »
[ Improve Your Python With 🐍 Python Tricks 💌 – Get a short & sweet Python Trick delivered to your inbox every couple of days. >> Click here to learn more and see examples ]


