
TradeCanvas 2.0 is out. npm install @tradecanvas/chart now gives you 2.0, and 1.x stays available as @tradecanvas/chart@1.
It went out as seven betas, and the release is those betas with a final number on them. For most pages, moving to 2.0 means changing nothing, or setting one option. The migration page lists every case.
A new default look
The chart and the widget now open with more room around what they draw:
- eight slots past the newest bar, where 1.x left five;
- more space above and below the prices;
- a gap between the candles and the volume band;
- the legend further in from the corner.
The widget is laid out on even pixels, and every hairline and wick lands on a whole device pixel. So the chart stays sharp at the 125% and 150% display scaling most Windows laptops run at. A trading chart on whole pixels explains how.
1.x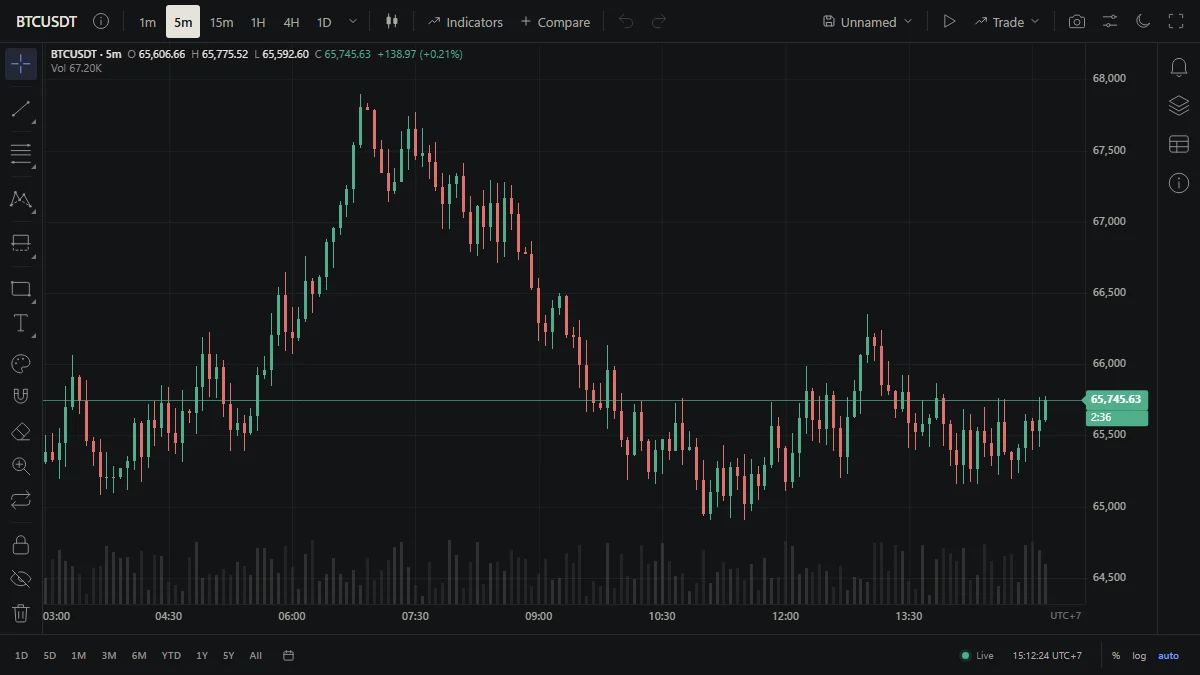
2.0
If your screens depend on the old proportions, one option keeps them:
new ChartWidget(host, { ui: { density: 'classic' } }) // the widget as in 1.x new Chart(host, { density: 'compact' }) // a chart of your own as in 1.x One face for figures
The axes, price tags, crosshair pills and legend now share one set of faces. That holds on a chart of your own, in the widget's default look and on the finance charts. Each face is a sans whose digits all have the same width, so prices still line up in columns.
1.x drew the plain chart and the finance charts in a monospaced face. Next to the widget they looked like another product. To get the monospaced figures back:
import { Chart, MONO_FONT_FAMILY } from '@tradecanvas/chart' new Chart(host, { font: { family: MONO_FONT_FAMILY } }) One spelling
The names deprecated during 1.x are removed:
-
setTimezoneand its kin (usesetTimeZone); -
EXCHANGE_TIMEZONE(useEXCHANGE_TIME_ZONE); -
SymbolInfo.timezone(usetimeZone); -
DEFAULT_FONT_FAMILY(useMONO_FONT_FAMILY).
TypeScript points at each use. One trap if you write plain JavaScript: a symbol built with timezone: is no longer read at all, so it loses its time zone without an error. Search your symbol code for timezone: before you upgrade.
The finance charts caught up
TradeCanvas has fourteen charts besides the trading chart, for the screens around it: depth, equity curve, waterfall, heatmap, gauge, sparkline and the rest. In 2.0 they work as one set:
- One frame: margins sized to their labels, round axis steps, the same tooltip style everywhere.
- Touch: a tap shows the tooltip.
- Language: a
localeoption writes numbers, percentages and dates in the reader's language. The words they draw can be replaced too: a depth chart'sspreadLabel, an equity curve'sbenchmarkLabel, a performance dashboard'slabels. - Accessibility: each chart describes itself to screen readers.

Smaller things that add up
- Panes share the room. However many indicator panes are open, the price pane keeps at least 38.2% of the height. In 1.x, six panes on a laptop could leave the price pane with nothing.
- Live data says what it does. A reconnect attempt is announced once, not twice. Leaving a symbol while its first bars are loading cancels that request.
- Agents know the finance charts. The MCP server gains
list_finance_charts, andlist_optionsandvalidate_optionstake a finance chart's class name, so an agent can check its options before it runs them.
Trying it
npm install @tradecanvas/chart The demos run on 2.0. Each chart type's page now says what the type is for, and switches between types of the same family on one market. The showcase is a full terminal of 2.0 charts, with the prompts that ask a coding agent for each panel. Every change, release by release, is in the changelog.


