When an Amazon Aurora MySQL-Compatible Edition or Amazon Relational Database Service (Amazon RDS) for MySQL database slows down, it can be hard to tell why. CPU graphs and slow-query logs rarely tell the whole story. The more direct answer usually lies in wait events. A wait event tells you what your sessions are waiting for: reading from storage, redo log flushes, acquiring an internal lock, or waiting for CPU time. Amazon CloudWatch Database Insights surfaces this data as DB load, so you can quickly see whether a database is constrained and, if so, on what.
Earlier MySQL wait-event guidance relied on the Performance Insights dashboard. Our 2018 post Tuning Amazon RDS for MySQL with Performance Insights walked through that workflow. The Performance Insights console experience has since moved into CloudWatch Database Insights, and the standalone console now redirects there, while the Performance Insights API continues to work unchanged. This post refreshes that guidance for the current tool. We show how to read DB load in Database Insights for a MySQL workload and translate the most common wait events into concrete actions. That way, you can help identify the real bottleneck instead of scaling the instance without knowing why.
Solution overview
Database Insights measures database activity as average active sessions (AAS). An active session is a connection that submits work to the engine and is either running on CPU or waiting for a resource. Database Insights samples active sessions each second, averages them over time, and reports this as the DB load metric. It plots DB load against a Max vCPU line that shows the instance’s CPU capacity.
This gives you a first read:
- DB load below Max vCPU – The database generally has capacity. Bottlenecks are usually specific queries or I/O, not overall saturation.
- DB load consistently above Max vCPU – More sessions are active than the instance has vCPUs, so sessions wait to run, queuing for CPU time, storage I/O, or a lock. The dominant wait events can help you identify which resource might be constrained.
For MySQL engines, wait events come from the MySQL Performance Schema. Because DB load is only the average active sessions, Database Insights can break it down by the wait event each session is in. This shows which wait consumes the most session time and correlates it with the top SQL statements driving the load. The authoritative list of MySQL wait events and their meanings is in Tuning Aurora MySQL with wait events. This post focuses on how to act on the ones you will see most often.
Prerequisites
Before you begin, make sure you have the following:
- An Aurora MySQL or RDS for MySQL instance with CloudWatch Database Insights enabled. Standard mode is on by default and is available at no cost. It provides 7 days of DB load history and the per-instance load, wait-event, and Top SQL views (including per-SQL statement statistics) used throughout this post. You can optionally extend Standard mode retention to between 1 and 24 months for an added cost, at the same price as Performance Insights. Advanced mode adds fleet-wide monitoring, so you can view and rank many database instances together from the Fleet Health Dashboard shown later. It also adds on-demand analysis of a past time window and includes 1 to 24 month retention at no extra cost. It carries an additional cost billed per vCPU-hour (per ACU-hour for Aurora Serverless). For the full list of what each mode includes, see the Standard and Advanced feature comparison in the CloudWatch Database Insights documentation, and then see Amazon CloudWatch pricing for cost details.
- For Aurora MySQL, wait-event data comes from the Performance Schema. When you create the instance with Database Insights turned on, Database Insights manages the Performance Schema automatically. If you enabled Database Insights on an existing instance, you might need to turn on the Performance Schema manually and reboot. See Enabling the Performance Schema for Performance Insights on Aurora MySQL.
- Permissions to view Database Insights in the Amazon CloudWatch console. At minimum this means read access to CloudWatch metrics (cloudwatch:GetMetricData, cloudwatch:GetMetricStatistics, cloudwatch:ListMetrics), Performance Insights actions (pi:GetResourceMetrics, pi:DescribeDimensionKeys, and related pi: actions), and rds:DescribeDBInstances and rds:DescribeDBClusters. For the complete AWS Identity and Access Management (IAM) policy, see the sample policy in Get started with CloudWatch Database Insights.
Read the load: DB load sliced by waits and top SQL
Open Database Insights for the instance, set the DB load chart to slice by waits, and choose the time window that covers the slowdown. (In Advanced mode you can run on-demand analysis for any past period, which helps when the slowdown has already passed.) Two questions guide every investigation:
- Is the database saturated? Compare DB load to the Max vCPU line over the problem window. Sustained load above the line means sessions are queuing for resources. Load below the line doesn’t always mean healthy, though: if one or two sessions hold a lock that blocks others, throughput can stall while DB load stays low. Locking waits still appear in the wait breakdown even when overall load is below the line.
- On what? Identify the one or two wait categories that make up most of the stacked load. Then select that wait to see the top SQL statements associated with it. This pivot, from a dominant wait to the specific statements causing it, is where you find most root causes.
The following figure shows the Database load chart for an Aurora MySQL instance, sliced by wait event. The dashed line marks Max vCPU, and each color is a wait category contributing to load.
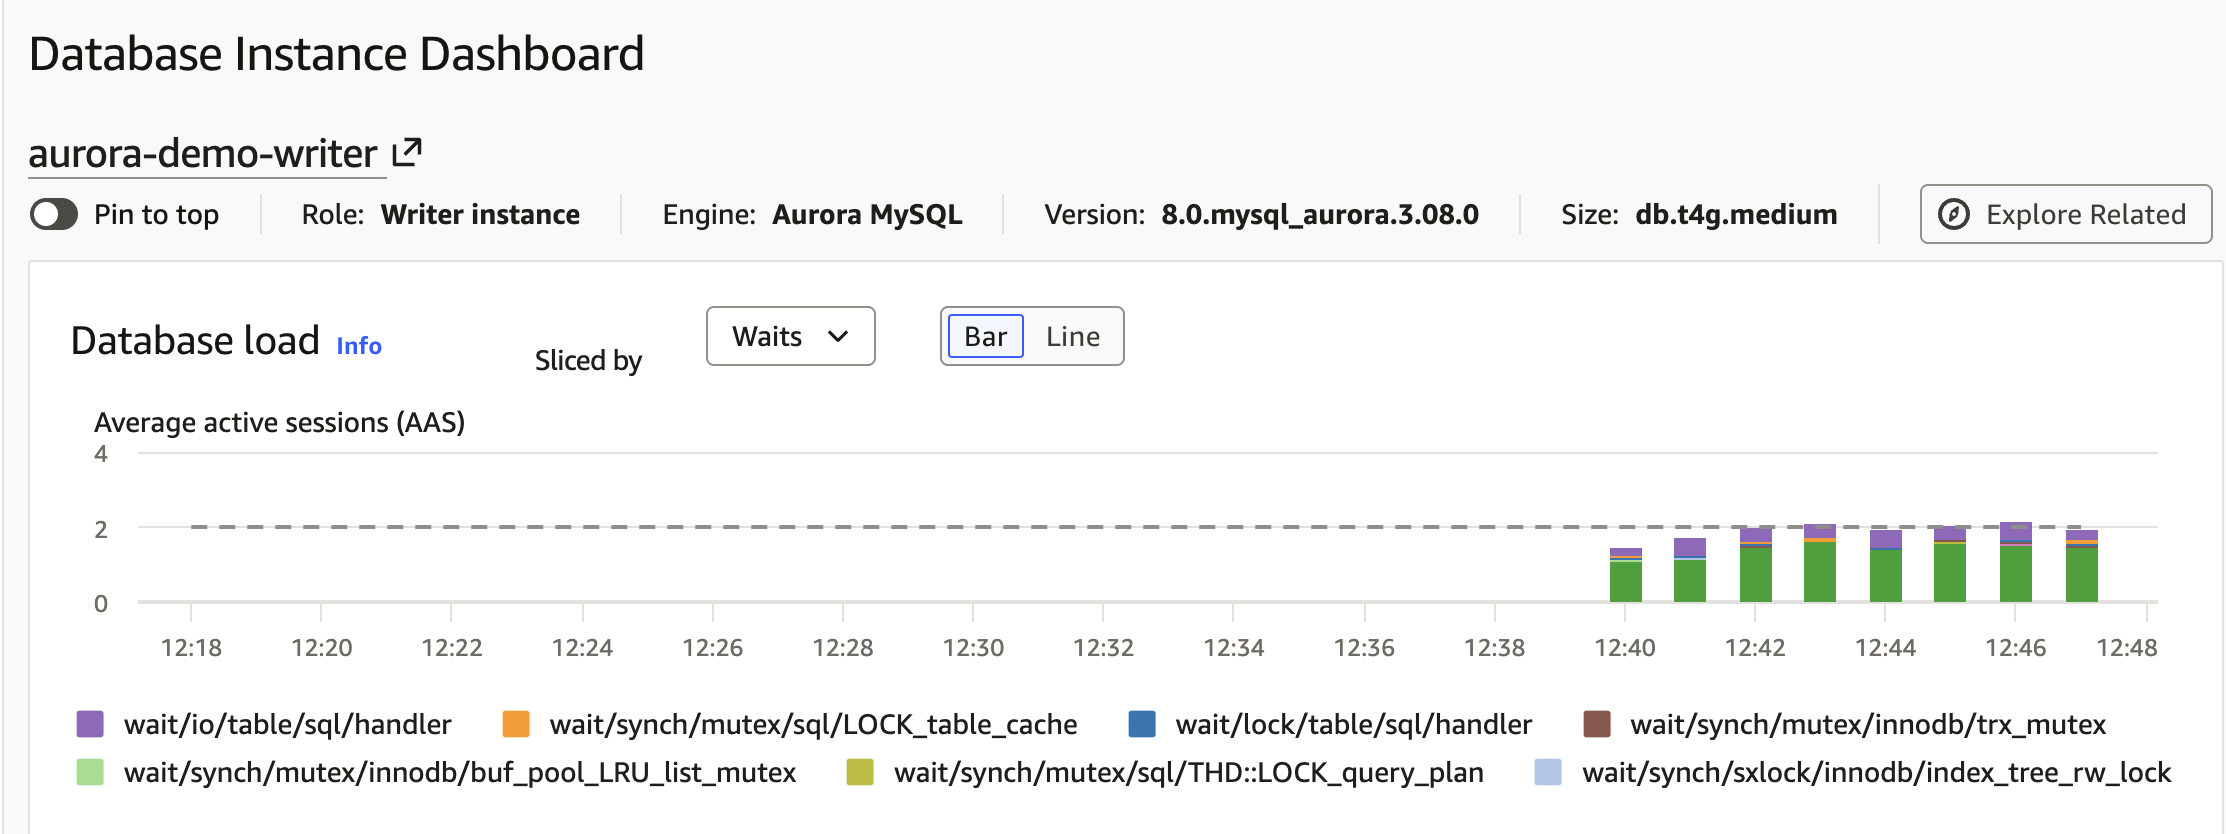
Figure 1: Database Insights DB load for an Aurora MySQL instance, sliced by wait event against the Max vCPU line
In this example, average active sessions sit right at the Max vCPU line, so the instance is running near its CPU capacity. The load is dominated by CPU (green), followed by wait/io/table/sql/handler (table I/O). That points the investigation toward the SQL consuming CPU and driving a high volume of row reads.
Selecting the dominant wait and opening the Top SQL tab surfaces the statements driving that load, ranked by their contribution.
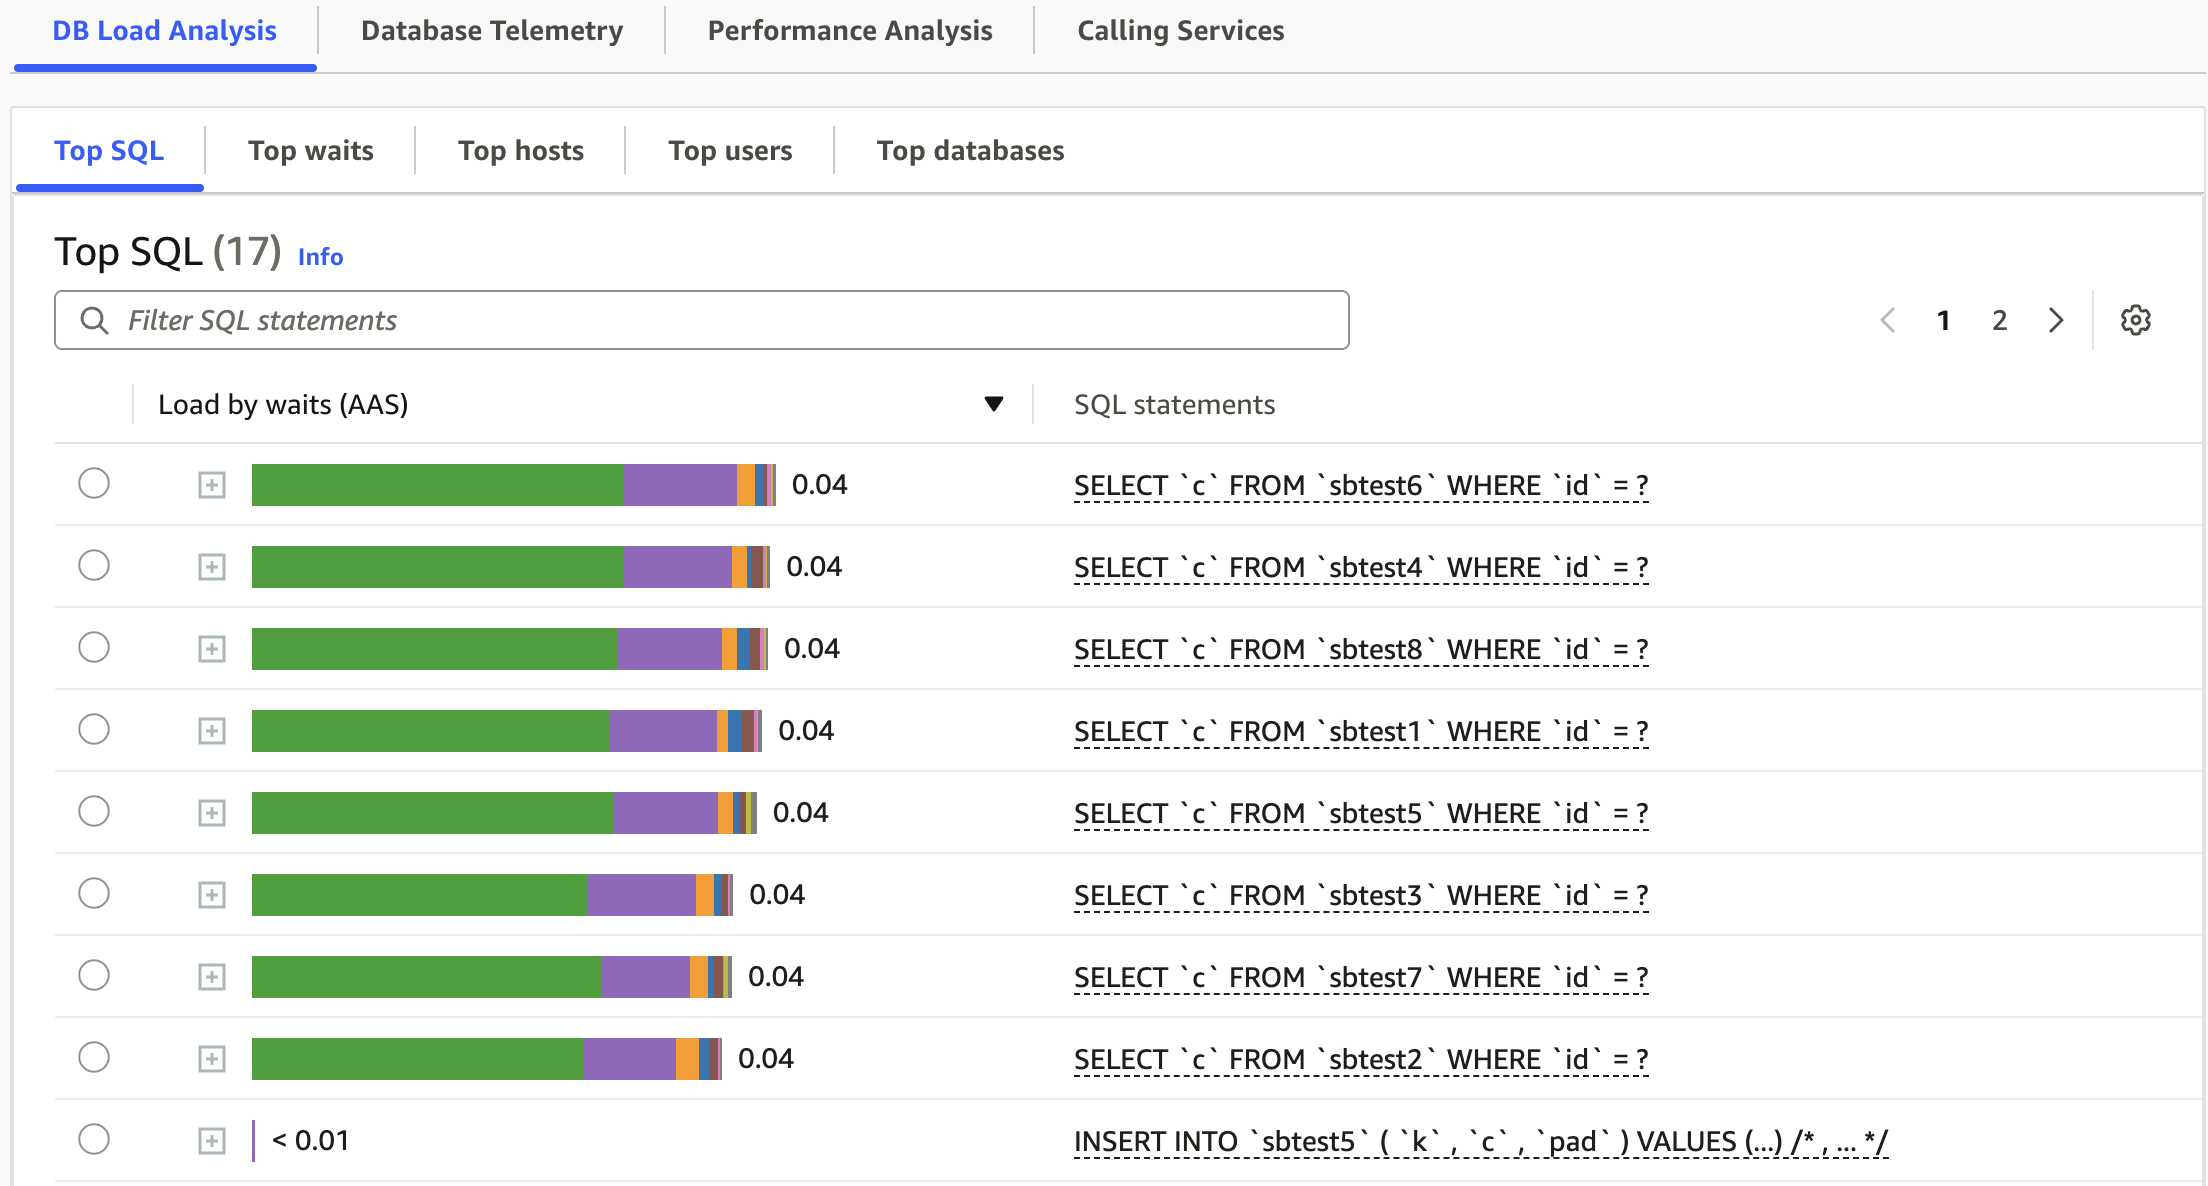
Figure 2: Top SQL ranked by load for the dominant wait, showing many near-identical point-select statements
Here the load is spread fairly evenly across many near-identical point-select statements (SELECT c FROM sbtest... WHERE id = ?), each contributing roughly 0.03–0.04 average active sessions. That pattern points to an aggregate CPU-bound online transaction processing (OLTP) workload rather than one expensive query. The remedy is to lower per-query CPU usage across the board through indexing, simplifying hot queries, and caching repeated reads, rather than hunting for a single outlier. To decide which remedy applies, use the Top SQL view. Statements that examine far more rows than they return are good index candidates, repeated identical reads are good caching candidates, and statements doing redundant work are candidates for simplification. The calls, rows-examined, and rows-sent statistics in the Top SQL view help you tell these apart.
Database Insights groups statements into digests with literal values replaced by ?, but full SQL samples can still contain literals. If your queries embed sensitive data as literal values, prefer parameterized queries and review the captured SQL text in a non-production environment before relying on it.
With that investigation method in mind, the next section covers what the common MySQL waits mean and what to do about each.
Wait-event playbook
The following are the wait events that most often dominate MySQL workloads. Treat the what to do items as starting points. Always confirm with the top SQL correlated to the wait before making changes.
CPU
The cpu wait event means a session is running on, or waiting for, a CPU. If cpu dominates and DB load sits above Max vCPU, the instance is CPU-bound.
What to do: Find the top SQL by CPU and reduce it: add or improve indexes to avoid full scans, simplify expensive joins and sorts, and cache repeated read-heavy queries. If the workload is genuinely CPU-bound after tuning, scale the instance class or offload reads to Aurora replicas.
io/aurora_redo_log_flush (Aurora MySQL-specific)
This event is specific to Aurora MySQL. On RDS for MySQL, commit-time flushing appears as standard InnoDB redo log I/O waits.
What to do: Batch small writes into larger transactions where the application allows, so you commit less frequently. Review whether every write path needs to be synchronous. For sustained high write I/O, evaluate Aurora I/O-Optimized cluster storage for cost predictability.
io/table/sql/handler
This event reflects table I/O through the storage engine handler, often the signature of large reads and full table scans.
What to do: Inspect the correlated SQL and its execution plan with EXPLAIN. Add indexes that support the query’s filter and join columns, avoid SELECT * on wide tables, and partition very large tables so scans touch less data. Aim for a buffer pool cache hit ratio high enough that most reads are served from memory.
SYNCH events (synch/mutex, synch/sxlock)
SYNCH waits occur when multiple sessions contend for the same in-memory structure that a mutex or lock protects. They often rise sharply as concurrency increases and can drive CPU up with them.
What to do: Reduce contention rather than only adding CPU. Look for hot rows or hot tables updated by many sessions at once, spread writes across more keys, and shorten transactions so locks are held briefly. See Troubleshoot SYNCH wait events for specific patterns.
io/socket/sql/client_connection
This event means the database is busy creating threads to handle incoming new connections. It indicates connection churn, where clients open and close connections rapidly.
What to do: Introduce or right-size application-side connection pooling so connections are reused, and consider Amazon RDS Proxy to pool and reuse connections. This is an application connectivity problem rather than a query problem, so scaling the instance will not fix it.
io/aurora_respond_to_client (Aurora MySQL-specific)
This event is specific to Aurora MySQL. On RDS for MySQL, time spent returning results appears under standard network and socket waits.
What to do: Return only the columns and rows the application needs, paginate large result sets, and check for network or client-side processing delays that keep the session open while it waits to return data.
Locking waits
When sessions wait on row or table locks, DB load rises even when CPU isn’t saturated, and throughput stalls under concurrency.
What to do: Keep transactions short, access rows in a consistent order to avoid deadlocks, and avoid long-running transactions that hold locks. Review isolation level and application retry logic for lock-wait timeouts and deadlocks.
Triage across a fleet with the Fleet Health Dashboard
When you run many databases, work top down: start at the fleet, rank instances by load, then drop into the per-instance wait and SQL views for the busiest ones. That triage starts with the Database Insights Fleet Health Dashboard, which shows DB load and health across a group of databases, so you can rank instances by load and open the busiest ones first.
The following figure shows the Fleet Health Dashboard ranking databases by DB load utilization, the ratio of DB load to the number of vCPUs. DB load shown here publishes to CloudWatch as the DBLoad metric, along with its DBLoadCPU and DBLoadNonCPU components. You can alarm on it and add it to CloudWatch dashboards next to the rest of your monitoring.
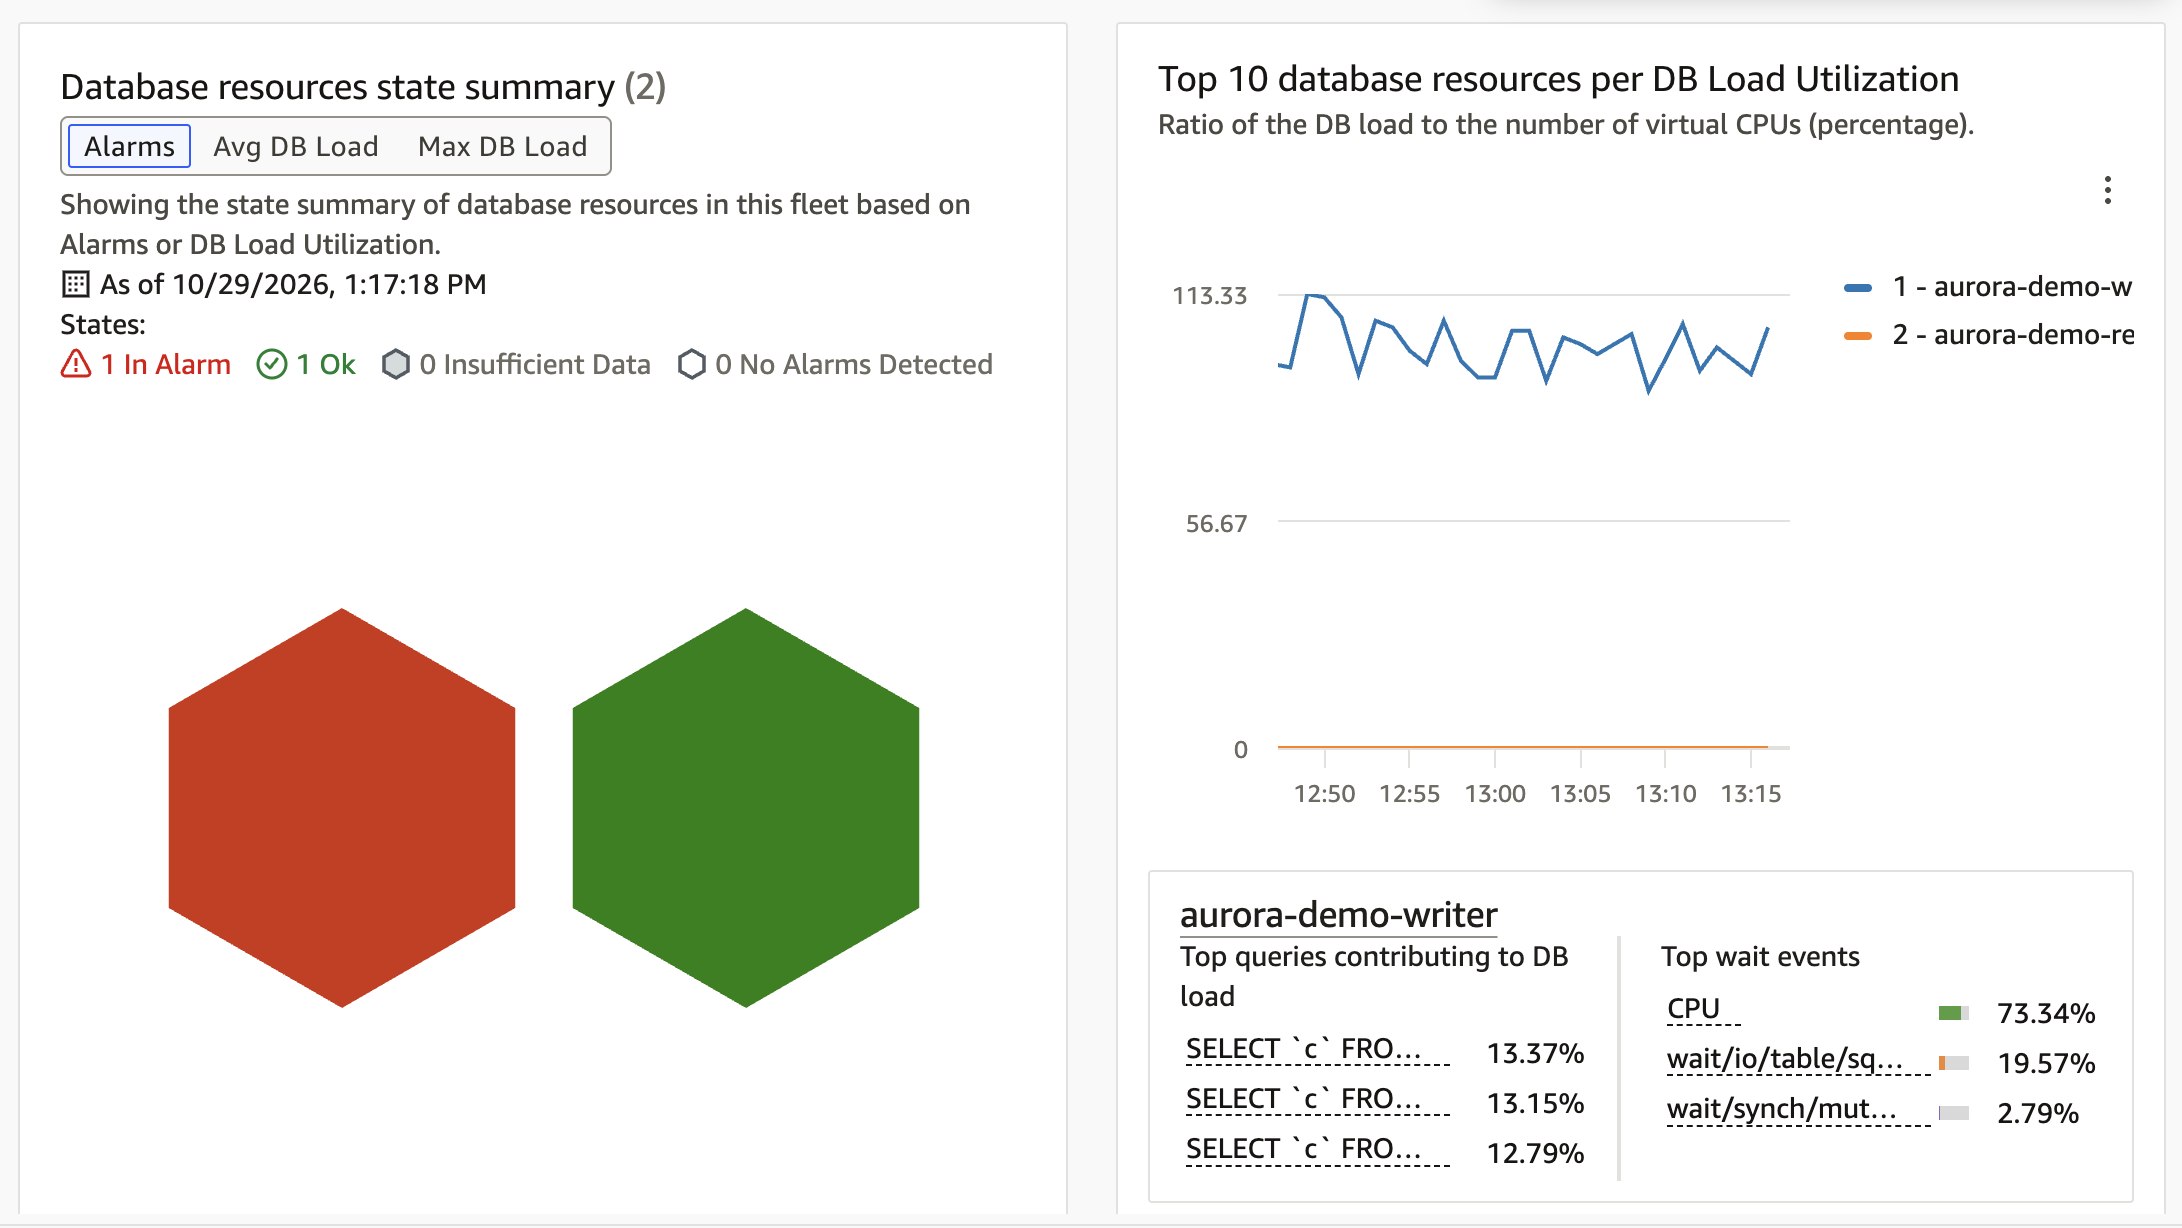
Figure 3: Fleet Health Dashboard ranking Aurora MySQL instances by DB load utilization
Here the writer instance tops the ranking at over 100 percent of its vCPU capacity, while the reader sits idle. Selecting the busiest resource surfaces its top queries and top wait events (in this case CPU at about 73 percent and io/table/sql/handler at about 20 percent). From there, you move from fleet triage straight into the per-instance playbook. Use fleet filters based on tags (for example, environment or application) to focus on the databases that matter.
This flow, from fleet to instance to wait to SQL, keeps investigations fast and repeatable, and it scales as you add databases.
Conclusion
In this post, we showed how to diagnose Amazon Aurora MySQL-Compatible Edition and Amazon RDS for MySQL performance using Amazon CloudWatch Database Insights. We covered how Database Insights represents load as average active sessions against instance capacity, how to slice load by wait event and pivot to the top SQL, what the most common MySQL wait events mean, and how to triage across a fleet. Reading wait events this way helps you fix the actual bottleneck rather than defaulting to a larger instance. The cause might be a query, an index, a connection pattern, or contention.
To learn more, see Tuning Aurora MySQL with wait events, Get started with CloudWatch Database Insights, and Essential concepts for Aurora MySQL tuning. For related guidance on the AWS Database Blog, see Amazon CloudWatch Database Insights applied in real scenarios and Analyze Amazon Aurora MySQL workloads with Performance Insights. If you have questions or suggestions, leave a comment, or visit AWS re:Post.


